#1 only trade 1% of your total asset #2 winrate and risk reward ratio #3 dont forced trade wait for set up. #4 get out when price hit target level #5 repeats
Man you are a revaluation for the trader's!Pure candlesticks and price action reading, nothing more, and nothing less!I am surprised, that you didn't get at least 1M views! On every single video.(Sorry for my bad English).No fancy Clancy indicators, and stupid stuff like 99% of videos posted on RUclips! Thank you man!
@@SamuelFord88 Mack doesn't explain like Thomas does. Mack does have more experience in price action but sometimes he goes Ali Brooks way, not explaining his mind. Thomas is nr.1 price action trader for sure!
Thank you for this. I dumped all of my indicators but the EMA and am employing these rules for price action trading. I'm still learning but have seen instant results. Your principles definitely work, not all the time but no setup works all the time, we're just trying to increase the probability of success. Your setup definitely accomplishes that as long as you're not greedy, set stop losses and and are fine with taking what the market presents to you. You have a new subscriber sir.
Thanx a lot. Content like these are a bit hard to find. I learnt a bit of price action by watching al brooks videos few years back. It changed my view of looking at markets. This video reminded me of him.
Your videos are extremely underrated. You have live videos -- which you can learn a ton from. And then these informational videos are just fantastic. I've been learning and studying price action for a long time now and your specific high probability setup that you show here is just fantastic. I've been a breakeven trader forever, but I really want to understand and take hold of this strategy.
@@rombusworkmoney22 I am currently a profitable trader after a year of studying and trading this strategy. My win rate isn't as high as some who do this strategy full time but I'm still making money doing it.
Been scouring the internet for information, striving for financial freedom. This alongside one of ur other videos has been the best and most comprehensive explanation ive seen so far with regards to understanding trading from the position of a complete beginner. Thanks a lot for sharing bro 😎
Thank you so much. I have followed you for a very long time and your knowledge and teaching styles have helped me SO much. I appreciate you and everything you do!
@@ThomasWade I think those guys would be proud of what you're teaching. I've watched them too and I really appreciate the way you explain the concepts and the detail you go into. You're very good at educating people. Thanks again!
I know these set ups quite well. Normally, whenever I review set ups, the one mistake they almost all make is entering the trade too late, such as waiting for the confirmation bar...the closing of the second bar after the set up bar. Studies have demonstrated this is very inefficient...costs you too much in profits. You entered both pull backs correctly, spot on. The second major mistake I detect is they place a stop loss at the swing low beneath their entry point if going long. HUGE mistake. Your stop losses on most trade should be just beneath the low of the bar you used to enter the trade or perhaps the low of the previous bar already closed out. I learned this from hard knocks and from Oliver Valez on RUclips, a great hedge fund trader.
Hi Thomas. Love the videos. Quick question regarding the 2EL starting @6:23. We obviously got a new high there follow by 2 red bars, then a green bar. Shouldn't that be the 1st entry since the red bar is above the green bar (@6:30)? And then 2EL would be where the red inverted hammer/doji bar is because it went above that second small green bar? Hope it make sense.
There is no 2EL on the bar you are talking about. Because after 1EL above big bull bar at the EMA, there was no tick below the bars working lower. There needs to be pullback, tick below for 2EL to get a chance to form. So after 1EL, there is a tick below the hammer doji and pullback started. After that we wait for break above the highs of bars to get 2EL.
Can you please give more details on what you mean by « a break below the low of the last bar inside a series of bullish leg ». I have trouble seeing what IS breaking below.
Great information in this video. I have a question on how to read the highs and lows of the candles. Are you counting the bodies and or the shadows? Please help
Thomas, great video. As for the last example, I think I didn’t understand the purpose of marking 2EL and FA2EL in this downtrend. Can you please explain a little more?
In the downtrend we mainly count for short entries - 2ES. But we can also use short setup when bulls are trapped - Failed Second Entry Long. For this reason we count for longs, not to go long but to see where 2EL failed.
8:15 is a first entry short because price ended on that tiny green candle below the top of the wick of the candle right before it? Still trying to piece it all together. thanks! 8:52 I don't get why that is a 1EL signal. Do you have a video where you explain the EXACT parameters of what an EL and ES signal are? 10:50 there is no tick above on that green bar to the bar previous why is that a 2EL?? 11:03 First bar that received a break above its high? which high are you referring to? edit: Okay I see you're referring to the bar AFTER that bar but the way you use your mouse and arrows it looks like you're pointing directly at those bars. starting to make sense now that i see you're referring to the bar afterwards in these examples. to anyone else struggling keep it up!
It may help you to consider that the bar he is indicating in the video is the signal bar. The entry long or short (first or second) is what occurs when the next bar ticks beyond the signal bar. The signal bar itself is important because it is not a high probability setup if the signal bar is not exhibiting a shape that is aligned with the trend. For example, you cannot take 2EL setup if the signal bar itself is bearish, even if the location of the bar is at key entry point. (There is a double bar entry setup that Thomas uses but it is a more advanced concept). But the entry long or entry short itself is when the range of the signal bar is exceeded, as you seem to have figured out. Honestly if you watch more of his videos, you'll start to understand. He does a really good job explaining price action concepts.
At 06:56 you sai it is a one candle pullback, but the low of the bar doesn't go below the low of the prior bar. I'm doing the Al Brooks course right now and he mentioned that the low of the bar needs to go below the low of the prior bar in an uptrend for the pullback to start. I'm a little confused right now, maybe you can clarify.
Hello, the bar doesn't have to break below the prior bar, important is the signal bar to have a break below its low. I made a community post about that. I recommend checking my community tab.
Trading! Interesting entry points - even very very tiny ones. However few confusing entries; in some examples when there is new low/high we restart count, but in other examples - this is just new leg… (7.50, 8.18, etccc). I Need to study more… Thanks!
Thanks Thomas. I have a question if you can, why at 12:22 the green doji(after the two full bull bars and bearish hammer counting from New Low) cannot be considered second entry long, since (with the wick) it went above he previous bar(red hammer)?
I suppose we could also count it as 2EL but it moved so far from the count reset point at the trendline. We prefer F2EL to be much closer to count reset point. Since the structure is downtrend, your main focus at first is to count entries short. Only when you reach the key entry point, you can look for failed second entries long too.
Thomas I'm sure you know more than me but the 2ES "signal bar" was the bear bar in leg two and the entry bar was the bar below it so the second bear bar. That is if you're going by Mack's rules. Not sure if you changed the rules to fit you.
Sometimes I call signal bar differently. I apologize for the confusion. Signal bar is always the lowest or higher point in the swing. But sometimes lets say 2EL forms above bearish bar, we cannot enter there, but right after close to it forms bullish bar. I treat the bullish bar as another signal bar. I call this double bar entry. But it should be used when the bull bar is not too far from the bearish signal bar and not that big.
@@ThomasWade < That's not a bad way to do it. If you combine the two bars you get a fairly bullish semi-diji anyway. Just making sure I was on the same page. Appreciate your response.
Mr. Thomas thank you so much for this video. With trendlines I’m assuming the lower timeframes might be choppy. What are great timeframes, higher or lower?
Nothing wrong with lower timeframes. Price action is same on all timeframes. I trade 2000 tick chart. Which is similar to 1 min chart. I use one bigger timeframe and that would be 10 k tick chart, similar to 5 min.
The good 2nd entry at key entry point doesn't form that often. Almost every day there are several good opportunities but you need to wait for all price action rules to align.
Thomas, at 3:47, you said "....This is 2 legged pull back, indicating to us bullish CORRECTION played out, the main trend resume......". Is it always that the correction is over after 2 legged pullback? In one of your videos "Market Rules Explained-How to countr Entries" (I know this video is about counting legs). At 12.34, the correction completed only after the 4th pullback.
No it is not always the two legged pullback but it is common. Sometimes you have just 1 leg pullback and market keeps going. Sometimes the correction trendline is in play and you have many legs. But two legged pullback is the high probability pullback if it forms under the right context and you follow all the price action rules.
Please refer 6:49 to 7:18. In a bull trend, after 2 leg pull back, do we reset the count even if there is no new high formed? For first red bar, you counted the leg as expected however there was one lower low red candle where you counted two legs again from start. I thought we continue to count the legs as 1,2,3,4... till new high is not formed. Is this logic also applicable for downtrend?
If I may, may I ask how do you compute your position size when you do scalping? Ain't there a minimum percentage change to gain a profit? Also, do you have any experience or sample wherein the trade has played out but you're still a loss because of fees? Your answer will be greatly appreciated. Thanks sir Thomas.
Hi, unfortunately I don't quite understand what are you asking. When scalping my main portion is the scalp portion. I don't want to leave money on the table and in case market does something unexpected I leave one contract as a runner. So I divide my positions into twos but the main one is the scalp, runner is bonus. You can only lose on commissions when you when you exit trade at break even. If the trade won you don't lose.
I just discovered your video and it is great informative for me! One question tho, let say buy setup, what indicates 1EL & 2EL, after 2-legged bearish, 1 bulish appear consider 1EL or require break above previous bar? Most of example do not breake above.
For entry to trigger there needs be trigger one tick above the signal bar. Bullish bar alone is not enough, there needs to be a trigger above that bullish signal bar. Here is the video aobut how to count entries ruclips.net/video/NNzCegosXu8/видео.html&ab_channel=ThomasWade
Are you buying on the next bar on the 2EL? Do you need to wait sometimes for a certain type of bar? Once 2 legs have played out, are you looking for continuation patterns or just going on the next bar? Hope that makes sense...
When 2EL signal bar gets a break above its high, I take the 2EL. I place my limit order on the signal bar. But technically we enter one bar after since that is triggering above signal bar. Bar is important, I buy above bullish bars and sell below bearish bars. You can check my live trades to see how I enter trades.
Ive been doing trades after 2 year losses-learning...this is the strategy ive discovered works...with DCA and stochtastics to get razor sharp entry at entry point
For it to be new low, the low has to be lower than the low we are counting from. Which 1ES still was higher then the count reset point. Takes time to get used to count, don't worry. Couple more weeks and it becomes second nature.
6:58 the price hasnt broken below the low of the candle that formed the high. My understanding was that the count starts once the price goes one tick below that candle in an uptrend?
When we are counting for longs we look for breaks above the high of the candles, not really lows. Break below the low of this candle is important if we want to look for second entry long.
Hi Thomas. This is very helpful. I am still somewhat confused as to where I can start a new count. Is it any new swing low or new swing high? It gets confusing when I am count long entries in a downtrend or short entries in an uptrend It would be good if you took this same video and mark where a new count would start with a 0 or something else. Thanks again. As always, great stuff.
If I may and if I understand correctly, when you are finding second failed entry short, count resets when the high of the current bar exceeds the high of the bar where you first identify the first short entry. And vice versa if your finding failed second long entry. Count resets when the low of the current bar exceeds the low of the bar where you identify the first long entry. Hope this helps.
Hello Chris, we tend to reset the count after significant event in the market. That means after two legged pullback to the key entry point or sometimes just important pullback to the key entry point. We reset the count after every second entry. So if we get 2ES at EMA, from there we count for F2EL.
what's this strategy's win rate, and how long does the drawdown period usually lasts? (this isn't my usual setup but its very interesting understanding it). thank you for making the video!
Win rate depends on the trade and how well you can read the price action and be mentally stable. Traders have easily over 80% with this but it takes years to learn, just like any other skill. Two legged pullback is just part of it, you need to learn to context as well, drawing trendlines.
@@ThomasWade definitely agreeing on pattern recognition being the key here to high win rate, the way you articulate charts out loud, it shows the years of effort you had put in reading charts via your mental framework. I am still developing mine as of now. I definitely have a foundation on understanding charts, but its the maturation that will take me much longer and it depends on how long I can sit down and read price action forming realtime
Thanks for breaking down what to actually look for during the two legs. It's been bugging me especially when it's not "obvious." Thanks for all you do!
Are we waiting for the tick counter to reach zero before we enter? Are we supposed to set limit orders and let price come to the entry on the 2EL or 2ES? Or are we supposed to take market orders? Sorry if I missed those answers. Thank you!
We enter based on candles that finished. Tick counter going to 0 or time counter reaching its interval means candle is fully printed. We want to see signal bar formed completely so we wait for signal bar to fully finish. I prefer limit orders after signal bar gets a break above/below its high/low. But you can use buy/sell stop orders as well. I am not a big fan of market orders.
@@ThomasWade Thank you for the reply. I much prefer to let the price come to me as well. I’m running on Simulation for a while and I’m making silly mistakes still, of course. The trend channel is a bit of a challenge but I’ll get it. I’ve been drawing them too early and not letting them develop, and that influences my entry. It’s practice and patience… and time. Thank you again. I appreciate your efforts and willingness to help make the strategy understandable and applicable. I’m free of indicators now except the 21 EMA 😎
@@dwaynedmullins Learning to read price action and to draw channels takes time. It is a skill like anything else. So it is completely normal to struggle at first.
@@ThomasWade I’ll get there… I’m really only confused on the count reset. Including the wick or not, etc., I just need to rewatch, slow down, print out charts and study them.
Signal bar size matters. Mostly if it is too big. That means our R:R ratio is not balanced. tiny signal bar also doesn't show momentum but as long as the bar is not too big or very tiny doji, doesn't matter that much. What matters more is the body and the wick.
For 2EL to trigger, it doesn't matter there the bar didn't break above the prior bar. All that matters for 2EL to trigger is that the SIGNAL bar gets the trigger above. So when you have signal bar for 2EL, that bar needs to have a break above.
Please correct me if I'm wrong: you don't require that a candle closes above or below a candle in question, do you? Wicking above/below is sufficient, correct?
i cant wait to get back to trading tomorrow moring, i went postive every single day last week. i think i needed to practice patience and mental strength. i only failed one trade all week on friday to start the day, but easily came right back to postive!
@@ThomasWade thank you I also made one trade on Tuesday and had a superb runner so I was happy with that and called it good with that one trade. I ended up not trading today on Thursday Cuase I got sick but I can’t wait for tomorrow! Wednesday I got lucky on my first trade and manage to get out with one point before it reversed and would stoped me out and that’s when the sickness had really kicked in so I just got off
I'm a bit confused on how do you count the bars, do you count where the price ends/closes on a bar or do you also count where the price has been for the whole bar no where where the price closed?
The main issue with pull backs to a MA, is they are fairly rare...how about a two bar pull backs in a trend or even better, a one bar pull back in a strong trend...90 percent successful.
I HAVE INCURRED SO MUCH LOSSES TRADING ON MY OWN...I TRADE WELL ON DEMO BUT I THINK THE REAL MARKET IS MANIPULATED... CAN ANYONE HELP ME OUT OR AT LEAST TELL ME WHAT I'M DOING WRONG ?
I strongly advise you against self trading, it's really dangerous and had brought so many investors down, you need someone with the knowledge and strategies, someone dedicated to the crypto currency market business, and I will strongly recommend expert, Mrs Mary Callahan Erdoes
Hello, it can but you need to adjust money management little. Also you may be waiting long time for a setup on higher timeframes. It works the best for scalping in my opinion.
Time stamp 7:18 why did you reset count? Price did not make a higher high? U started with 1st entry long even though price did not make a new high. Is it because u had micro double bottom at ema?
I will be forever grateful to you, you changed my entire life and I will continue to preach on your behalf for the whole world to hear you saved me from huge financial debt with just a small investment, thank you Mrs Katherine Flores.
great video man. i have a question It is very difficult to find that the signal bar is bullish or bearish... many times they are dojis. do we enter the same?
Context is very important, the stronger the context is the less signal bar matters. Also sometimes you have dojis with decent bullish or bearish tail. Generally if it is pure doji we skip the setup. If the doji has more bullish or bearish tail in your direction and context is good, you can still consider.


Patience+self discipline+control on emotionce= profitable trader
Ohh you forgot Risk Management
#1 only trade 1% of your total asset
#2 winrate and risk reward ratio
#3 dont forced trade wait for set up.
#4 get out when price hit target level
#5 repeats
Man you are a revaluation for the trader's!Pure candlesticks and price action reading, nothing more, and nothing less!I am surprised, that you didn't get at least 1M views! On every single video.(Sorry for my bad English).No fancy Clancy indicators, and stupid stuff like 99% of videos posted on RUclips! Thank you man!
Totally agree
It's cos most of this is from PATStrading... Nothing new
Its trash retail technical analysis.
Whats trash about it? Whats better? Thanks
@@SamuelFord88 Mack doesn't explain like Thomas does. Mack does have more experience in price action but sometimes he goes Ali Brooks way, not explaining his mind. Thomas is nr.1 price action trader for sure!
I've never seen anyone explain this in this way. Need to watch it a few times. This is an impressive video! Got a new sub after 1 watch!
Excellent explanation of this! One thing other videos never explain is a pullback and entry within a single bar.
Thank you for this. I dumped all of my indicators but the EMA and am employing these rules for price action trading. I'm still learning but have seen instant results. Your principles definitely work, not all the time but no setup works all the time, we're just trying to increase the probability of success. Your setup definitely accomplishes that as long as you're not greedy, set stop losses and and are fine with taking what the market presents to you. You have a new subscriber sir.
Thanx a lot. Content like these are a bit hard to find. I learnt a bit of price action by watching al brooks videos few years back. It changed my view of looking at markets. This video reminded me of him.
Your videos are extremely underrated. You have live videos -- which you can learn a ton from. And then these informational videos are just fantastic. I've been learning and studying price action for a long time now and your specific high probability setup that you show here is just fantastic. I've been a breakeven trader forever, but I really want to understand and take hold of this strategy.
What are your trading results now?
@@rombusworkmoney22 I am currently a profitable trader after a year of studying and trading this strategy. My win rate isn't as high as some who do this strategy full time but I'm still making money doing it.
this is one of your best videos! I appreciate the brevity and being straight to the point.
I didn’t realize these were the setups I’ve been doing the best with. Thanks for making things more clear!
Been scouring the internet for information, striving for financial freedom. This alongside one of ur other videos has been the best and most comprehensive explanation ive seen so far with regards to understanding trading from the position of a complete beginner. Thanks a lot for sharing bro 😎
Worlds best trading setup and video ever seen
I like the way you simplified setup concept, Many put complex indicators in vedios & miss lead others. Thanks buddy 😊
Thank you so much. I have followed you for a very long time and your knowledge and teaching styles have helped me SO much. I appreciate you and everything you do!
He's teachings has helped me a ton, too!!!
IMHO: the best Channel about PA & 2LPuB
holy cow, no clue what he is talking about but it makes a lot of sense! I hope there is a way to ask you questions because I have got a ton!
This is an awe-inspiring video. The second entry strategy is great. Awesome!!!
it doesn't get any better than your explanation, thank you
bro im not gonna lie, i appreciate your content, but i'm having a hard time keeping up with what you're saying.
You can slow the video down. It'll be easier to understand
Repeat the lesson video 3 times brother 🙌🏿🙏🏿📈📉
He is pointing to the wrong bar sometimes... once you realise that it will be easier to see the pattern and descriptions more clearly
Critical video, right to the core of reading the chart for consistent daily profits!
9:20 You will only become consistent when you wait for the high probability setups !!
TW - 2nd leg setup in a high probability entry.
Great video explaining the essence of PriceAction pullback. Love these videos refreshing price action knowledges.
Wow. Never thought of this. This is all a new dimension!! Thanks a lot and please do educate us.
Good video Thomas. I hope there will be a part two (the rest of the story). Thank you.
thank u thomas my way of learning price action changed its is avaluable information .
Thank you very much for making this easier to comprehend. great lesson. Thank you.
This is Mack’s price action trading system. I studied under him for years. Good job. 👍🏽
Yes, I learned from Al Brooks and Mack as well. Big shout-out to Mack. Great trader.
Mack who?
@@suhaibghazi7673 He's talking about PATsTrading Channel.
@@ThomasWade I think those guys would be proud of what you're teaching. I've watched them too and I really appreciate the way you explain the concepts and the detail you go into. You're very good at educating people. Thanks again!
Very valuable lesson. Thank you Thomas ✌️
I know these set ups quite well. Normally, whenever I review set ups, the one mistake they almost all make is entering the trade too late, such as waiting for the confirmation bar...the closing of the second bar after the set up bar. Studies have demonstrated this is very inefficient...costs you too much in profits. You entered both pull backs correctly, spot on. The second major mistake I detect is they place a stop loss at the swing low beneath their entry point if going long. HUGE mistake. Your stop losses on most trade should be just beneath the low of the bar you used to enter the trade or perhaps the low of the previous bar already closed out. I learned this from hard knocks and from Oliver Valez on RUclips, a great hedge fund trader.
Valez, not Valdez.
Hi Thomas. Love the videos. Quick question regarding the 2EL starting @6:23. We obviously got a new high there follow by 2 red bars, then a green bar. Shouldn't that be the 1st entry since the red bar is above the green bar (@6:30)? And then 2EL would be where the red inverted hammer/doji bar is because it went above that second small green bar? Hope it make sense.
There is no 2EL on the bar you are talking about. Because after 1EL above big bull bar at the EMA, there was no tick below the bars working lower. There needs to be pullback, tick below for 2EL to get a chance to form. So after 1EL, there is a tick below the hammer doji and pullback started. After that we wait for break above the highs of bars to get 2EL.
@@ThomasWade Got it. Thank you
Thank you soooo much for this !!!! You just changed my life !❤May God Continue to bless you sir !
Can you please give more details on what you mean by « a break below the low of the last bar inside a series of bullish leg ». I have trouble seeing what IS breaking below.
Great information in this video. I have a question on how to read the highs and lows of the candles. Are you counting the bodies and or the shadows? Please help
To count entries you want to see break above/below bars highs/lows. So this means above/below wicks as well.
Thomas, great video.
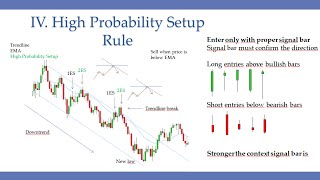
As for the last example, I think I didn’t understand the purpose of marking 2EL and FA2EL in this downtrend. Can you please explain a little more?
In the downtrend we mainly count for short entries - 2ES.
But we can also use short setup when bulls are trapped - Failed Second Entry Long. For this reason we count for longs, not to go long but to see where 2EL failed.
Thanks for information about probability....
great level of detail in your explanation TW. Thanks again.
8:15 is a first entry short because price ended on that tiny green candle below the top of the wick of the candle right before it? Still trying to piece it all together. thanks!
8:52 I don't get why that is a 1EL signal. Do you have a video where you explain the EXACT parameters of what an EL and ES signal are?
10:50 there is no tick above on that green bar to the bar previous why is that a 2EL??
11:03 First bar that received a break above its high? which high are you referring to? edit: Okay I see you're referring to the bar AFTER that bar but the way you use your mouse and arrows it looks like you're pointing directly at those bars.
starting to make sense now that i see you're referring to the bar afterwards in these examples. to anyone else struggling keep it up!
It may help you to consider that the bar he is indicating in the video is the signal bar. The entry long or short (first or second) is what occurs when the next bar ticks beyond the signal bar. The signal bar itself is important because it is not a high probability setup if the signal bar is not exhibiting a shape that is aligned with the trend. For example, you cannot take 2EL setup if the signal bar itself is bearish, even if the location of the bar is at key entry point. (There is a double bar entry setup that Thomas uses but it is a more advanced concept). But the entry long or entry short itself is when the range of the signal bar is exceeded, as you seem to have figured out.
Honestly if you watch more of his videos, you'll start to understand. He does a really good job explaining price action concepts.
Love this!!! Thank you 🙏!! Struggling to fully understand this. Great elaboration and explanation!!!
At 06:56 you sai it is a one candle pullback, but the low of the bar doesn't go below the low of the prior bar. I'm doing the Al Brooks course right now and he mentioned that the low of the bar needs to go below the low of the prior bar in an uptrend for the pullback to start. I'm a little confused right now, maybe you can clarify.
Hello, the bar doesn't have to break below the prior bar, important is the signal bar to have a break below its low. I made a community post about that. I recommend checking my community tab.
Thanks, found it!
Trading! Interesting entry points - even very very tiny ones. However few confusing entries; in some examples when there is new low/high we restart count, but in other examples - this is just new leg… (7.50, 8.18, etccc). I Need to study more… Thanks!
Thanks Thomas. I have a question if you can, why at 12:22 the green doji(after the two full bull bars and bearish hammer counting from New Low) cannot be considered second entry long, since (with the wick) it went above he previous bar(red hammer)?
I suppose we could also count it as 2EL but it moved so far from the count reset point at the trendline. We prefer F2EL to be much closer to count reset point. Since the structure is downtrend, your main focus at first is to count entries short. Only when you reach the key entry point, you can look for failed second entries long too.
Got it, very clear
This one of the best explanations of price action strategies that I've seen. Outstanding man!
Thomas I'm sure you know more than me but the 2ES "signal bar" was the bear bar in leg two and the entry bar was the bar below it so the second bear bar. That is if you're going by Mack's rules. Not sure if you changed the rules to fit you.
Sometimes I call signal bar differently. I apologize for the confusion. Signal bar is always the lowest or higher point in the swing. But sometimes lets say 2EL forms above bearish bar, we cannot enter there, but right after close to it forms bullish bar. I treat the bullish bar as another signal bar. I call this double bar entry. But it should be used when the bull bar is not too far from the bearish signal bar and not that big.
@@ThomasWade < That's not a bad way to do it. If you combine the two bars you get a fairly bullish semi-diji anyway. Just making sure I was on the same page. Appreciate your response.
Glad I found you. Thank you for sharing your insights and help. Paul
Great video and extremely useful. It makes a lot of sense. Thank you very much for taking the time to make the video and for sharing it.
Mr. Thomas thank you so much for this video. With trendlines I’m assuming the lower timeframes might be choppy. What are great timeframes, higher or lower?
Nothing wrong with lower timeframes. Price action is same on all timeframes. I trade 2000 tick chart. Which is similar to 1 min chart. I use one bigger timeframe and that would be 10 k tick chart, similar to 5 min.
Excellent video and great explanation. Really glad I found your channel - thanks!
Around 6:34 where he drew the second bearish leg, shouldn't the pull back be at the green /red candle before that?
11:25 the signal bar is a bearish doji. Are you taking that setup or taking the setup with a stop below the previous bullish bar?
If it is an inside bar the SL always has to go below the lowest point in that swing so below the outside bar.
Thanks for the great video. What TP should we aim for?
I use 2000 tick chart. 1-5 min are also good.
@@ThomasWade Thank you. I've started to use the 2000 tick as well. I am liking it better then the time base ones.
do you have any videos on signal bars? if so I would love to watch!
Now that I think about I don't have any specific video about signal bars.
@@ThomasWade I second that, this vid was great on the 2E! Hit it outa the park!
Great video but curious how often you'll get that second entry vs. just a single chance?
The good 2nd entry at key entry point doesn't form that often. Almost every day there are several good opportunities but you need to wait for all price action rules to align.
Thomas, at 3:47, you said "....This is 2 legged pull back, indicating to us bullish CORRECTION played out, the main trend resume......". Is it always that the correction is over after 2 legged pullback? In one of your videos "Market Rules Explained-How to countr Entries" (I know this video is about counting legs). At 12.34, the correction completed only after the 4th pullback.
No it is not always the two legged pullback but it is common. Sometimes you have just 1 leg pullback and market keeps going. Sometimes the correction trendline is in play and you have many legs.
But two legged pullback is the high probability pullback if it forms under the right context and you follow all the price action rules.
Please refer 6:49 to 7:18. In a bull trend, after 2 leg pull back, do we reset the count even if there is no new high formed?
For first red bar, you counted the leg as expected however there was one lower low red candle where you counted two legs again from start. I thought we continue to count the legs as 1,2,3,4... till new high is not formed.
Is this logic also applicable for downtrend?
If I may, may I ask how do you compute your position size when you do scalping? Ain't there a minimum percentage change to gain a profit? Also, do you have any experience or sample wherein the trade has played out but you're still a loss because of fees? Your answer will be greatly appreciated. Thanks sir Thomas.
Hi, unfortunately I don't quite understand what are you asking. When scalping my main portion is the scalp portion. I don't want to leave money on the table and in case market does something unexpected I leave one contract as a runner. So I divide my positions into twos but the main one is the scalp, runner is bonus.
You can only lose on commissions when you when you exit trade at break even. If the trade won you don't lose.
Thank you so much for this training on Trend lines❤
I just discovered your video and it is great informative for me! One question tho, let say buy setup, what indicates 1EL & 2EL, after 2-legged bearish, 1 bulish appear consider 1EL or require break above previous bar? Most of example do not breake above.
For entry to trigger there needs be trigger one tick above the signal bar. Bullish bar alone is not enough, there needs to be a trigger above that bullish signal bar.
Here is the video aobut how to count entries
ruclips.net/video/NNzCegosXu8/видео.html&ab_channel=ThomasWade
Brilliant. Thank you. 🙏🙏🙏
Are you buying on the next bar on the 2EL? Do you need to wait sometimes for a certain type of bar? Once 2 legs have played out, are you looking for continuation patterns or just going on the next bar? Hope that makes sense...
When 2EL signal bar gets a break above its high, I take the 2EL. I place my limit order on the signal bar. But technically we enter one bar after since that is triggering above signal bar.
Bar is important, I buy above bullish bars and sell below bearish bars.
You can check my live trades to see how I enter trades.
@ThomasWade what if the bar moves below before the bar closes? Or do you wait for a bar closes beforehand?
How do you watch your live trades?
Very helpful. Thanks a lot Thomas!
Thanks sir love form india 🙋
Ive been doing trades after 2 year losses-learning...this is the strategy ive discovered works...with DCA and stochtastics to get razor sharp entry at entry point
Thomas, I'm confused. At 8:15 the bar you call 1st entry short looks to me like a new low. What am I not understanding?
When do you count the wicks, or do you only count the opens and closes?
obviously, I am just a newbie trying not to lose money.
For it to be new low, the low has to be lower than the low we are counting from. Which 1ES still was higher then the count reset point. Takes time to get used to count, don't worry. Couple more weeks and it becomes second nature.
6:58 the price hasnt broken below the low of the candle that formed the high. My understanding was that the count starts once the price goes one tick below that candle in an uptrend?
When we are counting for longs we look for breaks above the high of the candles, not really lows. Break below the low of this candle is important if we want to look for second entry long.
Hi Thomas. This is very helpful. I am still somewhat confused as to where I can start a new count. Is it any new swing low or new swing high? It gets confusing when I am count long entries in a downtrend or short entries in an uptrend It would be good if you took this same video and mark where a new count would start with a 0 or something else. Thanks again. As always, great stuff.
If I may and if I understand correctly, when you are finding second failed entry short, count resets when the high of the current bar exceeds the high of the bar where you first identify the first short entry. And vice versa if your finding failed second long entry. Count resets when the low of the current bar exceeds the low of the bar where you identify the first long entry. Hope this helps.
Hello Chris, we tend to reset the count after significant event in the market. That means after two legged pullback to the key entry point or sometimes just important pullback to the key entry point.
We reset the count after every second entry. So if we get 2ES at EMA, from there we count for F2EL.
Another great video! Thanks Thomas!
These are all Entries for Scalping Strategy, and where the Target, How do you take your targets? Thanks Again!
You can see my live trading sessions to see how to manage scalping targets.
Hi Thomas, does 2nd entry needs to always be below 1st entry as confirmation LONG ENTRY and vice versa for shorts?
Love your videos, man!
2EL doesn't always have to be below 1EL, sometimes it can even be higher.
Pure Gold!!💰💰💰
You're a legend, thanks for the vids
what's this strategy's win rate, and how long does the drawdown period usually lasts? (this isn't my usual setup but its very interesting understanding it). thank you for making the video!
Win rate depends on the trade and how well you can read the price action and be mentally stable. Traders have easily over 80% with this but it takes years to learn, just like any other skill. Two legged pullback is just part of it, you need to learn to context as well, drawing trendlines.
@@ThomasWade definitely agreeing on pattern recognition being the key here to high win rate, the way you articulate charts out loud, it shows the years of effort you had put in reading charts via your mental framework.
I am still developing mine as of now. I definitely have a foundation on understanding charts, but its the maturation that will take me much longer and it depends on how long I can sit down and read price action forming realtime
Fantastic, thank you very much Sir for this enlightenment
Thanks for breaking down what to actually look for during the two legs. It's been bugging me especially when it's not "obvious." Thanks for all you do!
Thx for a great video. This should work on 1 minute time frame, correct? Thx!
Hi, correct.
@@ThomasWade Thx a million!
Very well explained!
Are we waiting for the tick counter to reach zero before we enter? Are we supposed to set limit orders and let price come to the entry on the 2EL or 2ES? Or are we supposed to take market orders? Sorry if I missed those answers. Thank you!
We enter based on candles that finished. Tick counter going to 0 or time counter reaching its interval means candle is fully printed. We want to see signal bar formed completely so we wait for signal bar to fully finish.
I prefer limit orders after signal bar gets a break above/below its high/low.
But you can use buy/sell stop orders as well.
I am not a big fan of market orders.
@@ThomasWade Thank you for the reply. I much prefer to let the price come to me as well. I’m running on Simulation for a while and I’m making silly mistakes still, of course. The trend channel is a bit of a challenge but I’ll get it. I’ve been drawing them too early and not letting them develop, and that influences my entry. It’s practice and patience… and time. Thank you again. I appreciate your efforts and willingness to help make the strategy understandable and applicable. I’m free of indicators now except the 21 EMA 😎
@@dwaynedmullins Learning to read price action and to draw channels takes time. It is a skill like anything else. So it is completely normal to struggle at first.
@@ThomasWade I’ll get there… I’m really only confused on the count reset. Including the wick or not, etc., I just need to rewatch, slow down, print out charts and study them.
Wick counts as a high/low
Could you please advise what timeframes you use? Thank you!
2000 tick chart.
Hello! Regarding entries does the size of the signal bar matter? It seems that you’ve entered on some spinning tops. Thank you!
Signal bar size matters. Mostly if it is too big. That means our R:R ratio is not balanced. tiny signal bar also doesn't show momentum but as long as the bar is not too big or very tiny doji, doesn't matter that much. What matters more is the body and the wick.
@Thomas Wade thank you! You are the best!
very helpful thomas! thank youu
how is that little green bar at 5:00 min a 2nd entry ??
it didnt break the high of previous bar ...
For 2EL to trigger, it doesn't matter there the bar didn't break above the prior bar. All that matters for 2EL to trigger is that the SIGNAL bar gets the trigger above. So when you have signal bar for 2EL, that bar needs to have a break above.
Thanks Thomas.
What software are you using to make the video and display the chart?
I use Ninjatrader and OBS.
@@ThomasWade thank you so much for the reply and that too so quick. May God bless you with good health and fortune and lots and lots of money!!!
Trading! In my previous comment situation was exactly the same but there this was not pullback but bearish trend down. A bit confusing :) 5:40
Am new to the forex trading journey...hope your videos will help me , Thomas...thank u
Please correct me if I'm wrong: you don't require that a candle closes above or below a candle in question, do you? Wicking above/below is sufficient, correct?
Yes, candle doesn't have to close higher/lower the prior bar. You just care about the signal bar getting a break.
i cant wait to get back to trading tomorrow moring, i went postive every single day last week. i think i needed to practice patience and mental strength. i only failed one trade all week on friday to start the day, but easily came right back to postive!
Great performance!
@@ThomasWade thank you I also made one trade on Tuesday and had a superb runner so I was happy with that and called it good with that one trade. I ended up not trading today on Thursday Cuase I got sick but I can’t wait for tomorrow! Wednesday I got lucky on my first trade and manage to get out with one point before it reversed and would stoped me out and that’s when the sickness had really kicked in so I just got off
I'm a bit confused on how do you count the bars, do you count where the price ends/closes on a bar or do you also count where the price has been for the whole bar no where where the price closed?
The highest/lowest point is the most important. So I always count from the close(if there is no wick) or the wick. The high or low of the bar.
The main issue with pull backs to a MA, is they are fairly rare...how about a two bar pull backs in a trend or even better, a one bar pull back in a strong trend...90 percent successful.
They are rare? Perhaps your MA number is too high? I use 21 bar EMA.
tomas씨 감사합니다. 이런 강의가 듣고 싶었어요^^
I don't speak this language :)
I HAVE INCURRED SO MUCH LOSSES TRADING ON MY OWN...I TRADE WELL ON DEMO BUT I THINK THE REAL MARKET IS MANIPULATED... CAN ANYONE HELP ME OUT OR AT LEAST TELL ME WHAT I'M DOING WRONG ?
Same here, My portfolio has been going down the drain while I try trading,l just don't know what I do wrong
I strongly advise you against self trading, it's really dangerous and had brought so many investors down, you need someone with the knowledge and strategies, someone dedicated to the crypto currency market business, and I will strongly recommend expert, Mrs Mary Callahan Erdoes
Wow I'm just shock you mentioned and recommended Expert Mrs Mary Callahan Erdoes ,I thought I'm the only trading with her
@@rossameg541You don't need to be shock because I'm also a huge beneficiary of Expert Mrs Mary Callahan Erdoes
Here in Canada Expert Mrs Mary Erdoes carries out the both orientation and mentorship
potentials
Hi Thomas,
The same concept can be used for SWING trading also?
Hello, it can but you need to adjust money management little. Also you may be waiting long time for a setup on higher timeframes. It works the best for scalping in my opinion.
@@ThomasWade
Thanks.
If trading the ES futures how big is your profit target for a scalp & how big is your maximum stop?
TP is 8-10 ticks, you can see in my live trading videos. SL always goes one tick below or above the EMA.
Time stamp 7:18 why did you reset count? Price did not make a higher high? U started with 1st entry long even though price did not make a new high. Is it because u had micro double bottom at ema?
thanks thomas another good things to know
Do you identify trend on larger timeframe or on intra day/ weekly
I trade intra day so most of my analysis is on 2000 tick chart. Similar to 1 minute. I use 10 000 just to look for bigger bias and channels.
@@ThomasWade understood thank you
How will I know when the top is okay to count from? Are we only taking this trade at all time highs?
Everytime a high is exceeded and new high in the uptrend is form, you reset the count for second entries.
@@ThomasWade so its the newest high from within the confines of a trend?
what Moving average did you used in this video?
I use 21 bar EMA.
@@ThomasWade Thank you sir!
I will be forever grateful to you, you changed my entire life and I will continue to preach on your behalf for the whole world to hear you saved me from huge financial debt with just a small investment, thank you Mrs Katherine Flores.
I'm surprised you know her. I've been making a lot of profits investing with her for a few months now.
Mrs Flores changed my life because of the high profits I got from investing with her.
You invest with Mrs Flores too? Wow that woman has been a blessing to me and my family.
I'm new at this, please how can I reach her?
I was skeptical at first till I decided to try. Its huge returns is awesome. I can't say much
Please post the PA along with volume confirmation..love to learn
I use only pure price action. I don't use volume. Some other traders do though.
@@ThomasWade thank you for your response
Thank you 😊
Good video
great video man. i have a question
It is very difficult to find that the signal bar is bullish or bearish... many times they are dojis. do we enter the same?
Context is very important, the stronger the context is the less signal bar matters.
Also sometimes you have dojis with decent bullish or bearish tail.
Generally if it is pure doji we skip the setup.
If the doji has more bullish or bearish tail in your direction and context is good, you can still consider.
@@ThomasWade THANKS Thomas. priceless tips