A Year of Weather 2020

HTML-код
- Опубликовано: 5 окт 2024
- Our annual Year of Weather videos are created thanks to the international cooperation with the China Meteorological Administration (CMA), the Japan Meteorological Agency (JMA) and the National Oceanic and Atmospheric Administration (NOAA). Merging their data with ours, we are able to get comprehensive views of the entire planet.
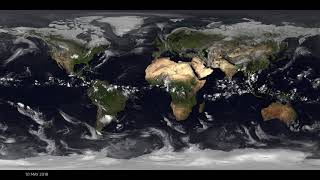
This animation shows the different weather patterns across the globe in 2020 as captured from space, with major storms labelled from light yellow to red depending on their intensity. The most active basin of the year was the North Atlantic, counting 30 named storms.
The ultra-high resolution (8K) visualisation has been produced by EUMETSAT's data visualisation team and is composed of a satellite infrared data layer, provided by Météo-France's Centre de Météorologie Spatiale, superimposed over NASA's 'Blue Marble Next Generation' ground maps, which change with the seasons.
Please note: The flickering in the video is due to the combination of data from the geostationary satellites of EUMETSAT, NOAA, the CMA and JMA, combined with data from EUMETSAT's polar-orbiting Metop satellites.


![OsamaSon - ik what you did last summer [Official Music Video]](http://i.ytimg.com/vi/4DIQDnu3mr4/mqdefault.jpg)


Watching a planet that is alive, breathing through the seasons. Thank you EUMETSAT these are incredible.
Thanks for your feedback! We're glad you find them useful :)
It's so interesting seeing the snowpack grow and retreat and grow again, same with the sunlight - you can see it move across (mostly reflected by the deserts) from east to west each day (or second!).
This was stunningly beautiful!
Awesome as always, but where is the usual commentary under it? You also promised it multiple times under last year's video, and nothing. :(
Hello, thanks for your feedback. Unfortunately due to the COVID-19 restrictions and home office, it wasn't possible this time. We hope to do it again in the future.
@@EUMETSAT1 But under the previous year's video you said that the voice version has been recorded and you haven't posted that one either. :( And how hard is it to give a microphone to that guy? Even most phones have awesome microphone quality if enchanced later.
My Analysis
Harold 165 mph 917 mb
Amphan 175 mph 899 mb
Haishen 160 mph 906 mb
Goni 195 mph 876 mb
Iota 165 mph 912 mb
Yasa 165 mph 912 mb
Yeah I agree iota was definitely a cat 5
@@lucaweatherdude_6542 tbh in my opinion I disagree
@@NotSomeoneM Same
Diciembre-Marzo
Yo: Hace frió
Marzo-Junio
Que bonito está el clima
Junio-Septiembre
Que calor
Septiembre-Diciembre
Bastante fresco
thank you 😊 so much
incredible!
Love the 3D
Magnificent 💜
Realy good composite video 😀 But I have a big question. When you allow free decoding for your satellite to the radio amateur's? Russia America and even China Not encoded they satellite stream 🤣 Okay I'm get it I'm staying at EWS-G1 low elevation from Europe but get the job done well.
Beautiful.
Wonder why they didn't put labels on the Northern Hemisphere East Pacific storms.
Was looking for the large dust cloud that came off of the Sahara in late June; can these satellites not see it?
Thank you for any clarity!
I seen a little bit of everything ...little bit of Heaven too...
@@kellycain4067 certainly beautiful to watch!
@@serethosgood601 i love that lion ..saw the woman in middle ...
@@serethosgood601 ❤️
Hello, thanks for getting in touch.
We have a specific dust product which makes it easier to see dust and this can be accessed on our data viewer, EUMETview: view.eumetsat.int
When in EUMETview, you need to click on 'Add layers' (box on the left) and then navigate to - MSG 0 Degree - RGB Composites - Dust RGB MSG 0 Degree. Then click 'Add to map' on the left hand side. The dust product should then be visible on the viewer and you can use the time slider at the bottom of the screen to look for imagery from a particular date. Dust in the imagery appears as a strong pink colour.
There is also a tutorial about working with EUMETview here:
ruclips.net/video/N9vkBTBUrc0/видео.html
Hope that's helpful!
Where is CYCLONE BURVEI
The bomb cyclone in brazil 4:55
Extratropical cyclone
🤔
first make Video weather 2020 years 👍👍
Topp
Wheres tropical storm wilfred
2:31 Indian ocean failed to be a storm
im waiting for the big boi Goni
Tuyệt vời !
Anyhow where we can get to certain regions only like Australia or the southwest pacific?
Amazing
❤️
someone answer these questions
What were the white masses on the map?
How did the movement change in the Northern Hemisphere from August to December?
What similarities did you notice in the movement in the norther and southern hemisphere?
How did those events given names seem similar and different from the other movement on the map?
Compare and contrast the movement you see over land vs over water. Describe the similarities and differences.
Look at places in the video and consider geography
Where has deserts? Is movement different there?
Hello, thanks for getting in touch! If you have specific questions about our products, please reach out to our helpdesk at: ops@eumetsat.int
Great video, but you missed only a couple of storms in the Atlantic. I will name them in the replies.
Nah, you missed a lot in the eastern pacific and Atlantic.
First the Atlantic, Arthur, Bertha, Christabol, Dolly, Edward, Fay, Gonzalo, Josephine, Kyle, Omar, Vicky, Welford, Alpha, And Beta.
And ALL of the eastern pacific
Sorry for being so harsh, but you never named tropical storms. Which count as named cyclones.
But over all, this is a 10/10 Vid great vid.
w o w !
It's too bad you guys didnt name the mediterranean storm and subtropical storm alpha at 7:00
They only name stuff that become category 1 or higher
The medicane is named janus
@@PicklEmpire Janus was an equivalent to category 2, the most powerful medicane recorded. Definitely should have been named on the map.
I saw a lot of hurricanes
4:54 Cyclone-bomb in Brazil
3:40 amphan
Catostrophic Storms
8:04
8:32
ok Kyle but why
^
^
Iota was a cat 4-
Oh heck nah I like better when it was a cat 5 until the NHC "reanaylsised" the storm as Cat 4
There’s no difference Iota was still a devastating storm 155 and 160 is just a 5 mph difference
@@Eastsidet03 Still I don't argee with their post analysis
@@supertyphoonnancy1963 I don’t agree with also I mean they should downgrade Lorenzo also they don’t have evidence that Lorenzo was even a C5 but that doesn’t mean Iota was a devastating and deadly storm as a C4
@@Eastsidet03 True. People should not care about the Category, its more the impacts they have to worry about.
❤😂😂🎉🎉😢😢😮😅
This proves earth is flat.