Hai bro can u pls tell us more elaborately about electrochemical studies from bascis like How to plot cv,lsv.... And why are plotting it and all it will be very useful and pls tell it by using Ec lab not nova2.1 bcozz we dont have it
I don't quite get it your question. if no semicircle in your Nyquist, then just include Rs, CPE and Warbung in your circuit dan the Nyquist plot will be well fitted.
Hi, this video looks cool! Can I get this software for free? How to arrange the data table (x y z) in excel? Can you suggest how to create Nox file? I really appreciate any help you can provide.
Free to download at metrohm webpage. Normally when you run using potenstiostat brand autolab. The data is automatically in nox. convert the data I still dont know.
@@DrHaffeast As I am using some other physical device for EIS experiment. I needed the software just to analyze the EIS data, however, the conversion from spec to .nox is challenging.
In the Nyquist plot, I have the experimental points and the fitting curve. PLEASE, How to extract the fitting data from the Nyquist plot using Nova software?
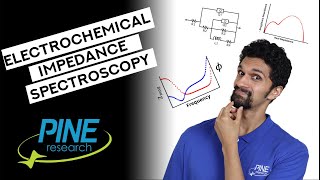
can you tell me what does it mean if the nyquist plot has no semicircle part in the graph instead it looks like half parabola . as i just knew from this video that one can fit in the software itself. well i used origin. with the equivalent circuit fit i got 3 resistances start and end value. could you please tell me how to distinguish Rct and Rs from that. Thanks in advance
First actually it depends on your sample some Nyquist plot show no semicircle at all, indicating your sample is conductive and no resistance at all. If your sample show half parabola, you must zoom in the starting Nyquist plot, maybe there is hidden semicircle that is too small for you to see. You should know that vertical straight line in Nyquist plot indicates very conductive sample while half parabola or 45 degree or more shows resistivity. In order to distinguish Rs and Rct, Rs is the total resistance at interface, bulk, charge transfer, solution and etc. Normally you can find Rs at the beginning of the Nyquist plot or semicircle at high frequency. On the other hand Rct depend on your application. Some application like dye sensitized solar cell have 3 Rct, supercapacitor has 1 Rct. However, its also depend on your material. Rct value only existed when semicircle is found in your Nyquist plot. Hope its help. Thanks.
Assalamualaikum & hello Dr Haff East. May i know what type of file that supported by nova for the eis data? I only have my data in excel/txt file only. Is possible for me to import the eis data to nova? Version use nova 2.1.7. Thank you Dr.!
Greetings, I would like to ask question thing regarding Nova software, currently I have plotted the EIS fitting graph, May I know how to display the frequency data of my circular fit on Nova software. The setting (software and machine same as in UKM, Malaysia). thank you
The impedance was auto generated by the software. Impedance equal to the diameter of semicircle that you can get by fitting the Nyquist plot. If you want to get the Tafel slope using Linear sweep voltammetry (LSV) just input the min and max voltage. No need the impedance value. FYI, you can also use linear polarization to get Tafel plot. Thanks. Hope it helps.
Salam Dr, i saved my raw data (Nyquist, Bode etc) in excel file. How do i open the excel data in Nova? I cant find the option except for GPES, FRA, or ASCII.
hi, what type of files that can be imported to load the data in this NOVA software? I try to import data from txt file it cant load the file, help me. thank youu
@@DrHaffeast after that sir?sir could you make a vedio please ,it's urgent and I check everywhere but I never found to generation or run CV / EIS for a material in 3 electric or 2 electrode system. Kindly do thos today
Hello, I would like to contact you via other modes if you are OK can you send me your email. I need your guidance regarding EIS analysis. I am new to this technique.


so much helpful. thanks a ton
please do post more videos
My pleasure.
Thanks so much for your video
welcome.
Really Helpful. Thanks a lot.
You are welcome.
@@DrHaffeast can you show a similar video on tafel plot measurement.
Hai bro can u pls tell us more elaborately about electrochemical studies from bascis like How to plot cv,lsv.... And why are plotting it and all it will be very useful and pls tell it by using Ec lab not nova2.1 bcozz we dont have it
Please how do I fix EIS of a supercapacitor measurement that is not just a duplication of a semi circle?
I don't quite get it your question. if no semicircle in your Nyquist, then just include Rs, CPE and Warbung in your circuit dan the Nyquist plot will be well fitted.
Hi, this video looks cool! Can I get this software for free? How to arrange the data table (x y z) in excel? Can you suggest how to create Nox file? I really appreciate any help you can provide.
Free to download at metrohm webpage. Normally when you run using potenstiostat brand autolab. The data is automatically in nox. convert the data I still dont know.
@@DrHaffeast As I am using some other physical device for EIS experiment. I needed the software just to analyze the EIS data, however, the conversion from spec to .nox is challenging.
www.ameteksi.com/products/software/zsimpwin
Please make a video about measuring galvanostatic charging discharging with different current density
done.
can you share the link of your publications
scholar.google.com/citations?user=hPiwkZEAAAAJ&hl=en
Please also make a video of calculations for eis and tafel
👌
Can I know specific calculation for what? Is it electron lifetime?
In the Nyquist plot, I have the experimental points and the fitting curve. PLEASE, How to extract the fitting data from the Nyquist plot using Nova software?
All the data is tabulated in the nova. You can just directly export.
can you tell me what does it mean if the nyquist plot has no semicircle part in the graph instead it looks like half parabola . as i just knew from this video that one can fit in the software itself. well i used origin. with the equivalent circuit fit i got 3 resistances start and end value. could you please tell me how to distinguish Rct and Rs from that. Thanks in advance
First actually it depends on your sample some Nyquist plot show no semicircle at all, indicating your sample is conductive and no resistance at all. If your sample show half parabola, you must zoom in the starting Nyquist plot, maybe there is hidden semicircle that is too small for you to see. You should know that vertical straight line in Nyquist plot indicates very conductive sample while half parabola or 45 degree or more shows resistivity.
In order to distinguish Rs and Rct, Rs is the total resistance at interface, bulk, charge transfer, solution and etc. Normally you can find Rs at the beginning of the Nyquist plot or semicircle at high frequency.
On the other hand Rct depend on your application. Some application like dye sensitized solar cell have 3 Rct, supercapacitor has 1 Rct. However, its also depend on your material. Rct value only existed when semicircle is found in your Nyquist plot.
Hope its help. Thanks.
@@DrHaffeast that was an eye opening answer for me. thank you so very much
why in this case don't you have the characteristic tail fromm Warburg after the semi-circle?
Normally DSSC does not have Warburg line. It actually depend on application.
Sir i have a question i have one small semi circle under the bigger semi circle.....
@@manashjyotidas3748 depends on application some got 3, some got 2 and some got 1 semicircle. Some even no apparent of semicircle.
@@DrHaffeast can u send me ur email id
Can u provide me your email id
Assalamualaikum & hello Dr Haff East. May i know what type of file that supported by nova for the eis data? I only have my data in excel/txt file only. Is possible for me to import the eis data to nova? Version use nova 2.1.7. Thank you Dr.!
Waalaikummussalam. Nox file only can be used.
However if you just have excell you can use ZSimpWin to fit the eis circuit.
Greetings, I would like to ask question thing regarding Nova software, currently I have plotted the EIS fitting graph, May I know how to display the frequency data of my circular fit on Nova software. The setting (software and machine same as in UKM, Malaysia). thank you
You can just copy for both real sample data and fitted data. Then, overlay it using excel or origin.
hello, how we calculate IR impedance , and how we apply it in the LSV data to plot Tafel slope.
The impedance was auto generated by the software. Impedance equal to the diameter of semicircle that you can get by fitting the Nyquist plot.
If you want to get the Tafel slope using Linear sweep voltammetry (LSV) just input the min and max voltage. No need the impedance value.
FYI, you can also use linear polarization to get Tafel plot. Thanks. Hope it helps.
Salam Dr, i saved my raw data (Nyquist, Bode etc) in excel file. How do i open the excel data in Nova? I cant find the option except for GPES, FRA, or ASCII.
excell cannot be open in nova. You can try other software call Zsim.
How to calculate time constant and Knee frequency from EIS?. In formula of time constant there is frequency how to find it?
So far as I know, we can only know Rs or ESR, Rct or Warburg. So I cant help you on that.
@@DrHaffeast Thankyou Sir ♥️
hi, what type of files that can be imported to load the data in this NOVA software? I try to import data from txt file it cant load the file, help me. thank youu
Nox and asci file.
@@DrHaffeast Aslam O alikum, Could not load ascii file. Can you share some .nox data file please for domo analysis purpose
Hi sir,
How we do generate /plot with material
First you should have either 3 electrode system or 2 Electrode system.
@@DrHaffeast after that sir?sir could you make a vedio please ,it's urgent and I check everywhere but I never found to generation or run CV / EIS for a material in 3 electric or 2 electrode system. Kindly do thos today
@@fatimanovel5114 The most important thing is you should have Potentiostat. Which brand you have?
@@fatimanovel5114 ruclips.net/video/eYKlTqaUDwY/видео.html
@@DrHaffeast sir I want to calculate for cr2o3 CV and EIS IN 3 electrode system theoretically.
Hello, could you please help me about Mott Schottky plot by Nova 2.1
Sorry not expert at that.
Sir
is it possible to convert excel file into raw material nova file
So we can easy use this software ?
Please refer to this video.
ruclips.net/video/KWwSRcHs_MA/видео.html
bro did you know how to calculate ESR ?, So now we got Rs and Rct from the Fit Nyquist Plot.
ESR equal to Rs
@@DrHaffeast ok bro , did you have some procedure of cv tests
@@kinpaireuay1916 normally in the nova sofware in the default procedure, you can find the CV test procedure there.
@@DrHaffeast ok, actually I updated to NOVA 2.1.5 the last version, now I can open your GCD files that help me a lot. thank you so much, bro.
@@kinpaireuay1916 the pleasure is mine.
Is this software free to download?
Actually we got the software after we bought the potenstiostat brand Autolab. Maybe you can try find it using google.
Hello,
I would like to contact you via other modes if you are OK can you send me your email. I need your guidance regarding EIS analysis. I am new to this technique.
You can just ask questions here. If I can answer, I will.