Statistics: Ch 2 Graphical Representation of Data (17 of 62) Mean or Average

HTML-код
- Опубликовано: 18 окт 2024
- Visit ilectureonline.com for more math and science lectures!
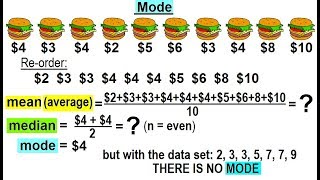
We will calculate the MEAN (average) of 5 houses sold in 2018 in Town A and Town B, and why average in not always a good indicator of what is really happening with the data.
To donate:
www.ilectureonl...
www.patreon.co...
.
Next video in this series can be seen at:
• Statistics: Ch 2 Graph...


![GEEK TIMË [OFFICIAL AUDIO]](http://i.ytimg.com/vi/ry-6RvkH880/mqdefault.jpg)


I have never seen this conceptual example about mean or average.🤔🤔🤔🤔 I am 100% sure no one is like you and no one will be come like you in future.You are the only one legend. Thank you so so much❤️❤️❤️❤️❤️❤️
thank you so much
Thanks 🙏