Thanks for sharing! I followed all the steps but in the Excel File the data of Baseline Cumulative Work and Cumulative Actual Work didn't show any data or numbers. Could you please advise how to fix this? Appreciate your reply!
Thanks for sharing! Do we need to key in the cost to generate the data? I followed your tutorial but it did not work. Hope you can assist with this. Thank you.
Hi, I have done creating the S curve, however, my baseline accumulative was 0 and the accumulative work was fine. Is there any missing step that I should do? Thanks
Hi Donny. When creating the visual report, a different progress update (previous month) is being generated in excel and calculates wrong percentages. Please advise.
Not sure what exactly is going on there but when you are in the part where you check fields to export, you can try to check everything that has "cumulative" on it and see if any of them reflects the current month/updates.
Hi bro, could you help me, i have followed your way but i have some problems. First when i adjust the date to be late on week for example, following task will be adjusted automatically shorter one week. So that, the cumulative will be same after all. What makes this thing happen? Thank in advance
Do you mean: if you adjust a task, the next task should stay in place, or be pushed? If stay in place, you need to disconnect the link between the task. If need to push forward, create a link between the task. If the second task does not move, right click on the second task and remove any Constraint
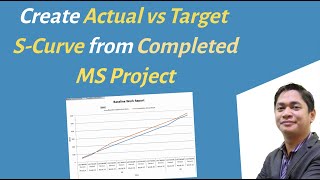
Hi, can i get some help. Actually i just need to show my target % vs actual % I've been searching 100 videos, and none have done so. is microsoft project unable to do such simple task? im abit frustrated
Hi, how it was exported to Excel is in the video. Not sure about your second question: do you mean how Project calculates cost? You may want to watch other videos in the playlist to see how you should enter the cost of each resource yourself. You cannot create an S-Curve with dates.


![Noob To Max With DRAGON REWORK In Blox Fruits [FULL MOVIE]](http://i.ytimg.com/vi/LnBMOinoOvA/mqdefault.jpg)
![Seungmin "그렇게, 천천히, 우리(As we are)" | [Stray Kids : SKZ-PLAYER]](http://i.ytimg.com/vi/kAzmhLHePqU/mqdefault.jpg)

great video tutorial. Do you have tutorial for financial S curve or cost monitoring s curve. Thanks.
Thanks for sharing!
I followed all the steps but in the Excel File the data of Baseline Cumulative Work and Cumulative Actual Work didn't show any data or numbers. Could you please advise how to fix this?
Appreciate your reply!
You have to assign the resources first. Then the work information will show up.
Thanks for sharing! Do we need to key in the cost to generate the data? I followed your tutorial but it did not work. Hope you can assist with this. Thank you.
I already at resources in the programme (Resource Type - Cost) but I still cant generate the report
Hi, just wondering.
What was the Earned Value Method you assigned for the tasks?
Does it have any impact on the S-Curve?
Good day, Engr. What if the data in the cumulative work and baseline cumulative work is not accumulating?
Hi, I have done creating the S curve, however, my baseline accumulative was 0 and the accumulative work was fine. Is there any missing step that I should do? Thanks
Hi, did you declare a baseline when you initially created your Gantt chart?
@@ExcelInsights hi Yes, I already set the baseline, then I change start and finish into baseline start and baseline finish
Can we create the S curve with the Material resource instead of Work?
Hi Donny. When creating the visual report, a different progress update (previous month) is being generated in excel and calculates wrong percentages. Please advise.
Not sure what exactly is going on there but when you are in the part where you check fields to export, you can try to check everything that has "cumulative" on it and see if any of them reflects the current month/updates.
Hi bro, could you help me, i have followed your way but i have some problems. First when i adjust the date to be late on week for example, following task will be adjusted automatically shorter one week. So that, the cumulative will be same after all. What makes this thing happen? Thank in advance
Do you mean: if you adjust a task, the next task should stay in place, or be pushed?
If stay in place, you need to disconnect the link between the task.
If need to push forward, create a link between the task. If the second task does not move, right click on the second task and remove any Constraint
I am not finding the baseline cumulative work when editing the template in the available fields, how to add it?
Hi, can i get some help.
Actually i just need to show my target % vs actual %
I've been searching 100 videos, and none have done so. is microsoft project unable to do such simple task? im abit frustrated
Hi Timothy, do you want to show this in the S-Curve report?
hi, nope, i actualy want to show this on the column. i got a sample (PDF) but im not sure how to recreate it. @@ExcelInsights
How does the data come in an excel sheet? and how the project calculates the data based on dates or costs?
Hi, how it was exported to Excel is in the video.
Not sure about your second question: do you mean how Project calculates cost?
You may want to watch other videos in the playlist to see how you should enter the cost of each resource yourself.
You cannot create an S-Curve with dates.
How do you get the weekly calendar filter to appear?
You need to keep clicking the square toggle buttons.
The data that was generated in excel for both baseline cumulative work and cumulative actual work was 0 for me, what am I missing?
I have the same problem, did you manage to resolve? Do you need the cost for the activities before it will generate?
I'm having same issue too. Any advice?
Hi, have you added resources and their costs?
@@ExcelInsights I'm sorry, not sure how to do that.
Try this ruclips.net/video/ANwKuLFF-5I/видео.html
Hi , why my chart value is all 0 pls help
Good job
thanks!
Hi , my msp hang when ever i clicked on the "visual report "tab🙃
If this only happens in that specific task, you need to repair/reinstall your MS Project