How to Simulate DC Transfer Curve of Differential Amplifiers

HTML-код
- Опубликовано: 15 фев 2024
- Understanding DC Transfer Curve of Differential Amplifiers | SPICE Simulation with KiCAD
Description:
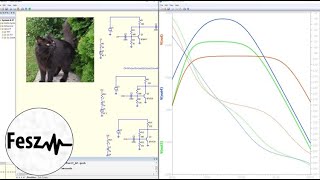
Welcome back to our channel! Today, we're exploring the DC transfer curve of a differential amplifier using BJT in KiCAD. We'll simulate how the amplifier responds to differential voltages applied to its input pins (V2 and V3). By plotting the output, we'll observe the linear range before saturation occurs.
The differential amplifier's response is crucial in understanding its behavior. As we sweep the input voltage, we'll see a linear rise in output within a certain range. Beyond this, saturation begins, indicating the limits of the amplifier's linear operation.
In this video, we'll walk you through setting up the circuit, running simulations, and interpreting the results step by step. From biasing transistors to setting up power supplies, we'll cover it all. Even if you're new to KiCAD or circuit simulation, you'll find this tutorial insightful.
Join us as we delve into the intricacies of differential amplifiers, providing practical insights and tips along the way. Don't forget to like, share, and subscribe for more educational content on electronics and circuit simulation!
Hashtags:
#DifferentialAmplifiers #KiCADSimulation #SPICESimulation #DCSweep #CircuitAnalysis #ElectronicsTutorial #BJTAmplifiers #LinearRange #Saturation #ElectronicsEducation #KiCADTutorial #SPICEModeling #AmplifierDesign