I saw at least five tutorials by now, asked three questions on stack-overflow cause that stuff never worked with my function. And finally I found a fellow scientist who gives this marvellous tutorial on curve fitting. Thank you a thousand times, it works!
Bless your soul, this was excellent. I was able to find non-linear relationships between temperature and electrical load of a city, for electricity load forecasting. THANK YOU!
How do you decide the best initial guess I also want to find a relationship between droplet diameter and height, but the r2 value is around 0.48 so how can I improve thank you
Thank you very much! I hope I can help any viewer with this other tips. # In this example, if you want to know the errors of the fitting parameters "a" and "b" you can add this line to your code: a, b = np.sqrt(np.diag(pcov)) # If you want to know the r^2 score of the fit, use this lines in your code: from sklearn.metrics import r2_score r2 = r2_score(yData, func(xData, *popt)) I wish you the best of lucks!
Thanks for this nice tutorial. I have a question. How can I calculate the r2 (r-squared) of the curve fit? Is there any way to convert the pcov to r2? THANKS!
Is it possible to choose the size of the y-axis? I mean, my experimental y values are very little and i want the graph only to show them in comparision with the curve fitting ...
Just an educated guess is usually enough. If you're modelling something you might have an idea about what to expect. In some cases even bad initial guesses may converge. If not then just try another one randomly if you have no odea about what to expect.
Each problem has a method to get initial values. In Process Simulation you must know where do you com from and what do you espect. There no exists a general method o mathematics for the initial value. Cheers
I have a question, how can you predict using the curve_fitted function for a specific value but no array, which isn't part of the dataframe? Let's say the x value is 6 and a prediction for this number is needed.
Can u do a curve fit with more than one curve, example u have 2 function/model with same parameter and u want to fit those curves with 2datas u have of that function respectively, maybe u can weight the residual of the curves?
Do you know if it is possible to use scipy functions instead of defining the fitting function yourself? That is, for example, if I want to make a fit my data with lognormal or power law equation, do I have to write it explicitly and change the parameters for each?
This is the most automatic it can get if you want to do meaningful science. We only need to define a fitting function here which we do so by considering the type of problem we are considering.
Is the code running? Since the curve_fit method requires an initial guess, so that may be the reason if the optimization doesn't converge. You can try different values for initial guess.


I saw at least five tutorials by now, asked three questions on stack-overflow cause that stuff never worked with my function. And finally I found a fellow scientist who gives this marvellous tutorial on curve fitting. Thank you a thousand times, it works!
Did you gibe him a sub and like? 😇
Same as I, this video answered all my questions.
Bless your soul, this was excellent. I was able to find non-linear relationships between temperature and electrical load of a city, for electricity load forecasting. THANK YOU!
I'm glad you found it useful 😊
How do you decide the best initial guess I also want to find a relationship between droplet diameter and height, but the r2 value is around 0.48 so how can I improve thank you
Thank you very much, friend, I've been suffering for two days what you can't imagine to achieve something like this.
absolute hero so much better than online forums/documentation explenations
Glad you think so!
Thank you very much! I hope I can help any viewer with this other tips.
# In this example, if you want to know the errors of the fitting parameters "a" and "b" you can add this line to your code:
a, b = np.sqrt(np.diag(pcov))
# If you want to know the r^2 score of the fit, use this lines in your code:
from sklearn.metrics import r2_score
r2 = r2_score(yData, func(xData, *popt))
I wish you the best of lucks!
Dude your a god that was so well explained! Love you!
Thanks for this nice tutorial. I have a question. How can I calculate the r2 (r-squared) of the curve fit? Is there any way to convert the pcov to r2? THANKS!
Is it possible to choose the size of the y-axis? I mean, my experimental y values are very little and i want the graph only to show them in comparision with the curve fitting ...
what an absolute legend
hi Mr., How do I know which initial values to consider for the initial conjecture of the parameters?
I will be grateful for the answer
Just an educated guess is usually enough. If you're modelling something you might have an idea about what to expect. In some cases even bad initial guesses may converge. If not then just try another one randomly if you have no odea about what to expect.
Each problem has a method to get initial values. In Process Simulation you must know where do you com from and what do you espect. There no exists a general method o mathematics for the initial value. Cheers
Thank you for the video! I have one question, how do I determine the uncertainty of the coefficients generated by the curvefit?
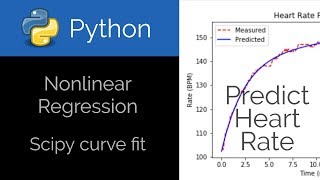
lovely content! thank you. but your plot .. talk about overfitting the data :D :D :D
sir kindly make video on improve the goodness(reduce SSE) of fitting curve, thank you
I have a question, how can you predict using the curve_fitted function for a specific value but no array, which isn't part of the dataframe? Let's say the x value is 6 and a prediction for this number is needed.
i got error saying " ImportError: cannot import name 'read_arguments' from partially initialized module 'popt' " could you please help?
U saved my life
I have this problem, where the data I'm trying to fit is not of polynomial/exponential form.
How can we compute the area under curve ( for exemple for an asymetric gaussian )
Thank you...simple and effective
Can u do a curve fit with more than one curve, example u have 2 function/model with same parameter and u want to fit those curves with 2datas u have of that function respectively, maybe u can weight the residual of the curves?
How do you find the R squared value?
Awesome!! This helped me a lot.
Do you know if it is possible to use scipy functions instead of defining the fitting function yourself? That is, for example, if I want to make a fit my data with lognormal or power law equation, do I have to write it explicitly and change the parameters for each?
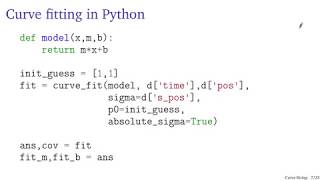
This is the most automatic it can get if you want to do meaningful science. We only need to define a fitting function here which we do so by considering the type of problem we are considering.
Thanks man! Very simple code.
Thank you so much for explaining in details. Can you explain why you wrote a=%5.3f, b=%5.3f in line 28 of your code?
It means it will print a floating point number with 5 characters, with 3 digits after the decimal point. It is just for formatting the output.
interesting topic. thanks.
Well done, thank you
thx sir
that was helpful :)
Hi, would you be able to help me I'm trying to fit a curve_fit through my data but it's not working?
Is the code running? Since the curve_fit method requires an initial guess, so that may be the reason if the optimization doesn't converge. You can try different values for initial guess.
The code does run and give a straight line , I have guessed the slope and intercept do I also need a start_slope and start_intercept?
You want to do a linear fit?
yeah a linear one , shall i send you my code?
Although the video is for non-linear fitting, you can still do linear fitting by modifying the func as:
def func(x,m,c):
return m*x+c
THANK YOU SO MUCH!!
How can we get the equation for curve?
Thanks for the help :))
how to get error ...??
can I still use curve_fit if I have errors in x but not in y?
Good question. curve_fit may not be the best choice in such a case. You may wanna try odr from scipy.
thanks sir
I tried to do same code, however python did not sketch the curve for me !
thanks
Can we do this on real dataset?
It depends on the amount of noise that your data might have. Also, if you have an idea about the what mathematical relationship should it follow.
I would prefer you to speak in your original accent, please
bhai tu gora nhe hy pr koshish poori kr rha hy k wsa boly mgr nhee
You know, You know kam bola kr
what ??
But what’s your problem