
- Видео 5
- Просмотров 89 676
Aarish Maqsood
Пакистан
Добавлен 18 окт 2015
Welcome to this channel. We are dedicated to providing you short techniques related to Engineering, including software.
We hope you will be benefited from this content. If you have any questions or queries, feel free to ask questions in the comments.
We hope you will be benefited from this content. If you have any questions or queries, feel free to ask questions in the comments.
Site Suitability Analysis in ArcGIS Pro | Model Builder | Export Map
Suitability Analysis allows you to qualify, compare, and rank candidate sites based on how closely they adhere to the criteria that you select and define. More information you can find in the following links.
Euclidean Distance: en.wikipedia.org/wiki/Euclidean_distance
Site Suitability Analysis: pro.arcgis.com/en/pro-app/latest/help/analysis/business-analyst/understanding-suitability-analysis.htm
Timestamp
0:00 Intro
1:02 Starting a New Project
2:38 ArcGIS Pro Interface
2:50 Options for adding the Data
3:29 SIte Suitability Intro
4:22 Slope
6:04 Euclidean Distance
8:23 Reclassification
14:05 Weight Overlay
18:27 Interpretation
18:59 Layout
28:41 Model Builder
37:07 Ending Remarks
Subscribe: ruclips.net/us...
Просмотров: 14 783
Видео
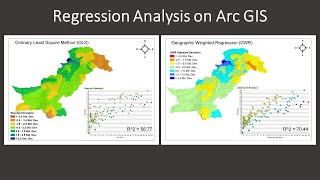

Regression Analysis on Arc GIS | Ordinary Least Squares | Graphically Weighted Regression
Просмотров 48 тыс.3 года назад
Check out the doc yourself here! desktop.arcgis.com/en/arcmap/10.3/tools/spatial-statistics-toolbox/regression-analysis-basics.htm In this video, I talk about regression analysis on Arc GIS. Which tool can be used for this analysis. and how it can be used on any dataset. Timestamp 0:00 Intro 0:18 Agenda 0:29 Regression Analysis 1:00 Correlation 1:54 Types of Regression 2:29 Tools used Arc GIS 2...

Shapefile from an image | Download shapefile of any country I Selection coordinate system | Arc GIS
Просмотров 1,6 тыс.4 года назад
A shapefile is a simple, nontopological format for storing the geometric location and attribute information of geographic features. Geographic features in a shapefile can be represented by points, lines, or polygons (areas). In this video, you will learn how to make a shapefile from an image, how to download the shapefile of any country with any attributes, and how to find the coordinate system...

Isohyetel method on Arc GIS | Calculation of area between contours
Просмотров 7 тыс.4 года назад
The isohyetal method is used to estimate the mean precipitation across an area by drawing lines of equal precipitation. The method uses topographic and other data to yield reliable estimates. Isohyets are contours of equal precipitation analogous to contour lines on a topographic map. Subscribe: ruclips.net/user/AarishMaqsood Twitter: aarishofficial/ LinkedIn : www.linkedin.com/in/a...

Thiessen polygon method on Arc GIS | Estimation of average rainfall
Просмотров 19 тыс.4 года назад
Polygons can be used to apportion a point coverage into polygons known as Thiessen or Voronoi polygons. Each polygon contains only one Input Features point. Each polygon has the unique property that any location within the polygon is closer to the polygon's point than to the point of any other polygon. This method can be easily solved on Arc GIS software. Just watch this video. Please subscribe...
This is great, but kindly share the data set used in the tutorial for practice
How do i get data to analyse
How a model can be validated?
Thank you for great lesson!
Good morning, I have wonder about Euclidean tool. If I have data as polygon should I need to convert it to point or just polygon can use for Euclidean too?
Straight to the point, and informative 👌🏾 Appreciate sir
done
I really appreciate your efforts bro, keep sharing what you know for others. In my first semester studies I struggled a lot on this Thiessen polygon, I wish I had the chance to watch it before. It was very helpful.
I tried this, following the steps but translating it so it applies to my project. When I get to weighted overlay and following the instructions, no image pops up like yours. Do you know a fix? When I right click the layer in the contents panel, there's no "Zoom to make layer visible"
can u plz show the model builder to multiply multiple raster layers and landfill site selection
This was very clear and easy to follow. Thank you.
Hello sir, I want to calculate significance analysis of NDVI, NDWI and NDBI change figures for the period 2008-2023, can you guide me please how do I calculate it and find p values for each change figure ?
You are hurry am not capture the steps
Hello, Please how can I get your data to run a suitability analysis
Did you use the landuse data as vector or was it Initially a raster then you converted to vector
This was a splendid video. I learned a lot from it.
very helpful!
So use full sir
Sir please make a video regarding , Uses of OLS/GWR in clinate change study.
I just want to ask for which time period you have predicted using this regression model?
thank you sir,. i have four years data of water quality data . i want to make time series map. could you please suggest me
Thank you so much this video is saving my work 😭
Is this the same as statistical downscaling of climate data? Thank you!
Please, Site suitability analysis pr Hindi me bhi ek video upload kijiye sir. 🙏🏼
THANK you so much . how do i now write a technical report on this
Great work. Can you tell me did you reversed each vector during reclassification?
hi Aarish How can i run Ordinary Least Square analysis between LAND USE LAND COVER AND POPULATION ?
I love your videos! your explanation is easy to swallow for beginners. Do you mind if I ask for the data that you're using here for me to follow the tutorial? thank you so much
I was about to ask for the same
Thanks for the tutorial.
i got a question: Where can I find an elevated river basin map with measuring stations on it?
pls help me how can i export polygon data in csv format in your vedeo?
Sir please make a video of distribution model
one of the best tutorials there is! THANK YOU :(
Very helpful lecture.
package file is not be able to reuse and after completing it. when i run on another pc model doesn't run ? what will be the reason kindly share plz.
good..keep it up
Dear brother, I have got your video, very good I like it a lot God bless You again!! But I already understand how to perform both OLS and GWR on Arc GIs!! The problem is How to arrange data in the attribute table to perform GWR modeling with the help of the Spatial Statistics tool in Arc GIs software?. For data preparation, especially in my case, I have Land use (Independent variable -5) and water quality indicators (Dependent variable -10) from different sampling points. What should my attribute table look like?? Thank You in Advance!!
Really amazing and helpful my new project thank you so much sir 😊
For the purpose of accidents Hot spots analysis can we use these tools for best results?? Which one is most suitable for my accidents data with lat and log. OLS or GWG??
kindly share the link of that video (difference between Ordinary Least Squares & Graphically Weighted Regression)
How to download the data you have used?
Brother give me your number i have a paid assignment for you
Very helpful video sir. Thank you so much. I want to know that, can we use this same procedure in Land-Use Regression having different variables as per specific study? Hoping for a reply from you sir.
Phenomenal work. Great job! Wish you the best of luck for your bright future!!💫
JazakAllah 🥰
Hi, can you please upload this shape file of pakistan citites?
Please watch this video, ruclips.net/video/FzA5t7wvSSQ/видео.html
@@AarishMaqsood Thankyou
No AHP?
AHP means?
@@AarishMaqsood Analytical Hierarchical Process
@@justinquarshie5732 Oh, I forget to add that. I will include it in my future videos.
Keep it up
how to add rainfall depth in table?
In this viedo you are taking rainfall depth ,is it annual rainfall or monthly rainfall of Rain gauge station. Please clarify
Good Job