
- Видео 14
- Просмотров 29 524
The BI Geek
США
Добавлен 14 июл 2020
In this channel we will discuss about different problem scenarios and tricks to create some amazing visualizations in Tableau and PowerBI.
Switch Charts by a Toggle Button in Tableau
In this tutorial we will learn how to switch between two different visuals based on a toggle button.
Просмотров: 677
Видео


Expand & Collapse a Vertical Filter Pane in Tableau
Просмотров 4042 месяца назад
In this video we will learn how to expand and collapse a vertical filter pane in Tableau Dashboard.

Tableau Rounded End Bar Chart in two minutes
Просмотров 3802 месяца назад
In this tutorial we will learn how to create round end bar chart. Round end Bar Charts are a kind of dual axis charts only but some with additional formatting and tricks. Here we will cover this in very simple and quick steps.
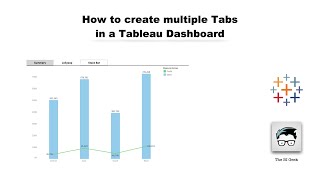
How to create explorer like tabs in a Tableau Dashboard
Просмотров 1,5 тыс.2 месяца назад
In this tutorial we will learn how to create tabs in a Tableau dashboard and also to add navigation to these tabs.

How to sort using Parameter in Tableau
Просмотров 6642 месяца назад
In this video we will learn how to sort a table by any measure values using Parameter.

Simplest Dual Axis Chart in Tableau
Просмотров 1262 месяца назад
In this Tutorial we will learn how to create a dual axis chart in Tableau.

Lollypop Chart in Tableau
Просмотров 692 месяца назад
In this tutorial we will learn how to create a Lollypop Chart in Tableau.

Stack Bar Chart Totals - in Tableau
Просмотров 392 месяца назад
In this tutorial we will see how to show the Total on top of a stack bar in Tableau using Analytics.

Stack Bar with Multiple Dimension & Measure - In Tableau
Просмотров 2612 месяца назад
In this tutorial we will discuss how to create two type of Stack Bar Charts. One with multiple dimensions and other with multiple Measures.
Changing Dimension & Measure using Parameter | Tableau
Просмотров 6 тыс.3 года назад
In this Tutorial we will learn how to change the Dimensions or Measures used in a Tableau Chart, dynamically using Parameters.
Waterfall Chart in Tableau
Просмотров 5543 года назад
In this tutorial we will learn how to create a Waterfall Chart in Tableau.
Donut Chart in Tableau
Просмотров 8 тыс.3 года назад
In this tutorial we will learn how to create a Donut chart step by step.
How to add a Viz. in Tooltip? | Tooltip Tips & Tricks | Tableau
Просмотров 3333 года назад
In this tutorial we will learn how to add a viz (or Hover Report) in tooltip of a Tableau Dashboard and change the filters dynamically.
Passing Parameters in URL Action | Tableau
Просмотров 11 тыс.3 года назад
In this tutorial we will learn how to pass parameters in URL, while using URL actions in Tableau Dashboard. Here will use a source dashboard from where we will call another Tableau dashboard and filter the target dashboard using parameters. Link for Source Dashboard - public.tableau.com/profile/shashank.shah3560#!/vizhome/PassingParameterinURLAction-Source/Dashboard1 Link for Target Dashboard -...
Thanks a lot dude!
Simple and easily understood the concept. Thank you
Such a great video please do more videos like this it will be very useful for us
How to implement expand and collapse layout containers based on selection of Hamburger filter option But filters are in horizontal container
Anything that can be done about the small bar that just looks like a circle??
Click on Edit Axis > Under Range select Custom > In "Fixed Start" enter 0 (it must be having some -ve value)
thanks for your explanation. can we make with more than one measure or dimension?
Thank you so much.
How to remove border lines of the pie when u hover on it
Great help as always. Thanks
Thanks a lot... how to display corresponding header in the chart depends on selected dimension.
THANKS A LOTTTT🔥🔥🔥
Nice…. I have one doubt. If the measurement, one is numerical value and another one is percentage then how we will sort out
Thanks for the video. Does it possible to add more than 1 dimension at a time instead of only 1 in the report??
Hello, I'm getting "missing fields on sheet error" in URL action dialogue box. Any idea what am I missing here?
Very helful!! Thanks
Amazing thank you very much
you rock, this is really very helpful thank you so much
if I want to increase the distance of the label from the pieces of the donut chart, is there a way to do so and insert a line to each corresponding label?
I am facing some problems in my project. Lets Take an Example --- Could you please tell me If there is category wise sales in one dashboard and sub-category wise sales in another. When we publish it to the Tableau Server how to link them through the action url means If you click on any category sales it will open the second dashboard in which it will show only related sub-category wise sales that we have selected on the first dashboard. Kindly help me.
very helpful, thanks for this
I am trying to pass a date parameter and Name parameter. But when I pass only name, it works fine and when I add "&date+filter=<start-end date>" name dropdown shows blank. Date is getting selected but name is not getting selected so it is showing blank page. What to do in this case
👌👌
Thanks. Helpful
Very nice explanation . Expecting more videos.
Simple and life saver tutorial
Hey what if I want to open the link in same window.
very well explained ...keep the good work ...
What if the data in sub category is not display when we select sub category ...
clear and easy! thanks
Simple and effective.Thanks, man
awesome!, thanks
You're welcome!
How to create multiple donuts in a single sheet?
You need to follow the same steps. Just at the very end, drag the dimension field for which you need multiple Donuts to the column shelf and clear the Size mark.
Good one useful.thanks for sharing
You are welcome!
quick question regarding this. are these parameters passed to Custom query or to the reports where you have all the data for country, region and state in the target dashboard already queried from database?
These parameters are passed to the Dashboard not to the Query actually.
easy and clear! thanks!
Thanks! Let know if you want me to make videos on any specific problem in Tableau.
I have similar requirements, dashboard has many filters and all are multi-select. While passing parameters, url becomes too big and gives error. Is there any other way of passing filters?
Not that I am aware of.
Can we pass filters instead of parameters
These parameters are acting as filters for the report we are navigating to and so acting as a filter only. Hope this helps, or let me know your problem statement I will take a look and revert.
Very Informative
Thanks!