
- Видео 103
- Просмотров 269 968
Gaurav Sahani
Индия
Добавлен 5 ноя 2020
Hello, I am Gaurav Sahani!🙋♂️ Learning and Growing by Sharing! | Tableau | Kaggle 2x Master🏅 | Data Science Blogger & Content Creator!
Tableau Dashboard for Nike Sales | Dashboard from Scratch | Part 2
This video demonstrates how to create a Simple Dashboard using different types of charts including a map chart, a bar chart, line plot, and more (step by step). This is a Descriptive Analysis using Nike Sales data. This dashboard is specially made for Beginners! Any reviews and suggestions are appreciated!
This second part brings all data visualizations into a single dashboard, with amazing cosmetics and interactions!
Connect me on Linkedin: www.linkedin.com/in/gaurav-sahani-6177a7179/
Thanks for Watching!🥰
#tableau #dataanalysis #dashboard #tableaupublic
This second part brings all data visualizations into a single dashboard, with amazing cosmetics and interactions!
Connect me on Linkedin: www.linkedin.com/in/gaurav-sahani-6177a7179/
Thanks for Watching!🥰
#tableau #dataanalysis #dashboard #tableaupublic
Просмотров: 1 404
Видео


Tableau Dashboard for Nike Sales | Dashboard from Scratch | Part 1
Просмотров 1,7 тыс.8 месяцев назад
This video demonstrates how to create a Simple Dashboard using different types of charts including a map chart, a bar chart, line plot, and more (step by step). This is a Descriptive Analysis using Nike Sales data. This dashboard is specially made for Beginners! Any reviews and suggestions are appreciated! You can download this dashboard from tableau public online: Link: public.tableau.com/view...

Generate INSANE AI ART for FREE 🔥| Quick QR Art
Просмотров 1279 месяцев назад
Unlock Your Creative Potential with Quick QR Art and AI Image Generation in 2023! Are you curious about the world of AI-generated art? In this video, I will guide you through the exciting realm of AI artistry using Quick QR Art and other cutting-edge tools like Hugging Face and Midjourney. Whether you're a complete beginner or an experienced artist looking to explore AI-driven creativity, this ...

DALL-E 3 Inside ChatGPT | First Impression & Examples!👀
Просмотров 2189 месяцев назад
"Dive into the latest breakthrough in generative AI as we explore the DALL-E 3 beta version, brought to you by the makers of ChatGPT! 🎨✨ In this video, we'll answer questions like "Is DALL-E included in ChatGPT Plus?" and "How can I access ChatGPT?". Witness the evolution from DALL-E2 to the enhanced DALL-E 3 and understand the wonders of combining the textual prowess of ChatGPT with the visual...

ChatGPT Vision | Most STUNNING Examples!🤯
Просмотров 2,5 тыс.9 месяцев назад
🔍 Dive into the incredible world of ChatGPT Vision with us! From its groundbreaking advancements to its futuristic vision statement, we uncover the true essence of this technology by OpenAI. Ever wondered, "What is ChatGPT used for?" or "What is the vision of ChatGPT?" - We've got you covered. Not only do we explore the core functionalities of chatgpt openai, but we also shed light on the unsee...

ChatGPT made my PowerPoint Presentations, don't tell my Boss!🤫
Просмотров 27410 месяцев назад
ChatGPT can serve as a valuable resource for enhancing your PowerPoint presentation creation process by offering inspiration, aiding in research, refining language, and even assisting with the incorporation of visual elements. This support can significantly contribute to the development of a persuasive and impactful presentation. Here is an amazing short video to guide you, on how you can creat...
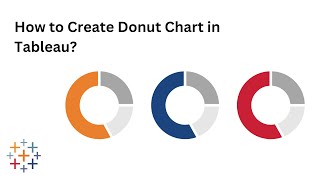
How to build a Donut Chart in Tableau
Просмотров 91910 месяцев назад
Welcome to my Tableau tutorial on creating captivating Donut Charts! In this video, we explore the significance of Donut Charts in Tableau, how to find them within the Tableau software, and provide a step-by-step guide on crafting these visually appealing data visualizations. If you're looking to elevate your data storytelling with Donut Charts, this tutorial is your go-to resource. Join us on ...

Beginners Guide to Tableau Calculated Fields
Просмотров 2,8 тыс.10 месяцев назад
Welcome to my RUclips tutorial on Tableau calculated fields! If you're new to Tableau or looking to enhance your data visualization skills, you've come to the right place. In this video, we'll explore various types of calculated fields in Tableau, catering to beginners and enthusiasts alike. 📊 Table of Contents: 🧮 Aggregated Calculations: Learn how to harness the power of aggregated calculation...

USA Universities Analysis - Tableau Tutorial for Beginners - Part 2
Просмотров 25011 месяцев назад
This Tutorial is specially made for beginners to learn Tableau using data regarding universities in the USA offering MIS courses! This video delivers answers to the below questions:🔥 1. How universities in the US are admitting applicants based on GRE, English scores, and previous work experience? 2. Is work experience mandatory to get into the university you wished for? 3. The trend of required...
USA Universities Analysis - Tableau Tutorial for Beginners - Part 1
Просмотров 76311 месяцев назад
This Tutorial is specially made for beginners to learn Tableau using data regarding universities in the USA offering MIS courses! This video delivers answers to the below questions:🔥 1. How universities in the US are admitting applicants based on GRE, English scores, and previous work experience? 2. Is work experience mandatory to get into the university you wished for? 3. The trend of required...
Ultimate guide to choose best suitable chart types!
Просмотров 204Год назад
Hello learners! Here is a fresh new video after a long time, about how you can choose the best visuals for your dashboard or requirements! This video is specially made for Beginners to help them get first-hand idea about how can they present their data in an impactful manner! Any reviews and suggestions are appreciated! Link to website: gramener.github.io/visual-vocabulary-vega/# Connect me on ...
Ultimate Beginners guide for Tableau Charts - Part 1
Просмотров 3142 года назад
Tableau for Beginners - Learn how to create charts in Tableau in quick, easy steps! Have discussed the importance and use case for each chart discussed in this part-1, with a video tutorial in the background! Hope this video is helpful! Thank you so much for watching! #tableau #tutorial #charts #graphs #powerbi #datascience
Make Tableau Maps Visually Attractive with Mapbox
Просмотров 1,6 тыс.2 года назад
Make your Tableau visualizations & maps super attractive using Mapbox integration! In this tutorial, I'll showcase how you can convert your boring tableau maps into some visually attractive maps using mapbox! (A photoshop for Maps!) where you can customize your map visualizations as per your choice & requirements! Connect me on Linkedin: www.linkedin.com/in/gaurav-sahani-6177a7179/ Thanks for W...
How to Search Jobs on LinkedIn (the Right way!)
Просмотров 5272 года назад
How to Search Jobs on LinkedIn (the Right way!)
IPL CSK Player Statistics Tableau Dashboard Tutorial | Part - 2
Просмотров 1,8 тыс.2 года назад
IPL CSK Player Statistics Tableau Dashboard Tutorial | Part - 2
IPL CSK Player Statistics Tableau Dashboard Tutorial | Part - 1
Просмотров 4,1 тыс.2 года назад
IPL CSK Player Statistics Tableau Dashboard Tutorial | Part - 1
All About Tableau Certifications | Is it Really Worth it?
Просмотров 2,5 тыс.2 года назад
All About Tableau Certifications | Is it Really Worth it?
How to connect MySQL Database to Tableau | Step by Step Tutorial
Просмотров 29 тыс.2 года назад
How to connect MySQL Database to Tableau | Step by Step Tutorial
Time series forecasting on Tableau | Made Simple
Просмотров 9 тыс.2 года назад
Time series forecasting on Tableau | Made Simple
How to Download & Use Tableau for Free
Просмотров 6 тыс.2 года назад
How to Download & Use Tableau for Free
Top 4 BI Tools in 2022 | Best Business Intelligence Tools
Просмотров 3,2 тыс.2 года назад
Top 4 BI Tools in 2022 | Best Business Intelligence Tools
Tableau Dashboard for Airbnb Data | Dashboard from Scratch | Part 2
Просмотров 14 тыс.2 года назад
Tableau Dashboard for Airbnb Data | Dashboard from Scratch | Part 2
Tableau Dashboard for Airbnb Data | Dashboard from Scratch | Part 1
Просмотров 28 тыс.2 года назад
Tableau Dashboard for Airbnb Data | Dashboard from Scratch | Part 1
Build a Tableau Dashboard | Pokemon Data Analysis
Просмотров 6 тыс.2 года назад
Build a Tableau Dashboard | Pokemon Data Analysis
Tableau Public vs Desktop | Download Tableau Public for FREE ✅
Просмотров 10 тыс.2 года назад
Tableau Public vs Desktop | Download Tableau Public for FREE ✅
Tableau End to End Dashboard Tutorial for Beginners | Tableau for Beginners
Просмотров 8 тыс.2 года назад
Tableau End to End Dashboard Tutorial for Beginners | Tableau for Beginners
Work From Home: Tips to Stay FOCUSED At Your WORK!
Просмотров 1222 года назад
Work From Home: Tips to Stay FOCUSED At Your WORK!
Welcome 2022 | Year End Travel Glimpse | Mumbai to GOA Roadtrip 😍
Просмотров 2352 года назад
Welcome 2022 | Year End Travel Glimpse | Mumbai to GOA Roadtrip 😍
Free Websites to learn Data Science in 2022 🎄
Просмотров 1,5 тыс.2 года назад
Free Websites to learn Data Science in 2022 🎄
Data Science in Banking | Transforming Banking domain
Просмотров 1,9 тыс.2 года назад
Data Science in Banking | Transforming Banking domain
Can I have a option to connect with mySQL with 14 day free trial!!! .. plz answer sir
Use right map of India
Hi Sir How to do group level avg
can we get this data set
Thank you sir!
Thank you for explaining everything so beautifully :)
Thankyouu! :)
Very informative. Thanks
You can try pygwalker, which is an open source tableau alternative and can be easily used in jupyter notebook
Hi , Gaurav can I get the dataset which you are using
Thank you, took me 2 days to figure out how to connect. Found your video and voila it was done in 5 minutes.
Haha, glad it was helpful! Happy learning! :)
It’s asking me to download driver what should I do
At 13:39 there are 4 donut charts so my 1st 3 charts are sticking to each other and the last chart is far away Not alligned properly how to fix this ?
At 23:52 there are 4 donut charts so my 1st 3 charts are sticking to each other and the last chart is far away Not alligned properly how to fix this ?
thank u sir, understood everything
Great explanation, helped me debug some errors. Thank you!
how can i get the data file in the video, i got into the link dataset but it was just only raw data
underrated video 10/10🙌
I can't find my tabelau repositary.. so what is the way to add photos of the palyers
I am not able to open the haarcascade_car.xml, what to do? is the file working for everyone?
So, this example was not for Tableau Public, only for the paid version, correct?
great info
Thank you!
yes share the nike banner
Shared in Part 1 Description! Thanks for watching!
finally the waiting is over🔥🔥🔥
video banaya tha toh link v daal deta bhai
waiting for part2
Coming soon!
Second part is uploaded!💫
This was very helpful in my finals, thanks!!
"import numpy as np" is shown above but never used, pls explain!
Why are my avg. attack, defense, and speed windows not moving?
Even though he was an experiment, MewTwo was my favorite. Under that was Squirtle.
Best Tableau tutorial! This is a great add to my portfolio. Thank you so much.
Glad to hear this! Check out my other tutorials as well! Happy learning!
Please give data set
Have added link in video description! Thanks for watching!
Hello Gaurav! Where can I put in my sql query and get it explained by visualization?
'promosm' ✋
It was really insightful 💯
Thankyou so much!🙌
Man I'm a plus subscriber still haven't got the image option yet, did u get it automatically
As soon as I upgraded to Gpt 4.0, I got the upload image option!
It just kinda appears.
Wow, awesome video
Many Thanks!:)
Wow this method is so easy and helpful in creating our last minute presentations. It will surely help in my next presentation.
Glad it was helpful! Many Thanks!
Im gonna try this weekend. Thank you Gaurav
what if after running the compare_models line we do not get an output?
is it free trial for limited time ?
Tableau public is free for lifetime
feels like tony stark is talking. nicely explained
Many Thanks! :)
@@GauravSahani14 hi gaurav can u help me with few things I have started learning tableau ?
@@siddharthsingh6561Sure, connect me on LinkedIn
@@GauravSahani14 i tried to connect with u on there
Hi, where can I find a dataset ?
I'll add the dataset link in description! Thanks
@@GauravSahani14 Thanks a million, it is very helpful tutorial.
@@stanislavsergeevich9459 Most Welcome! Shared the data in description!
This is really helpful. Thank you so much.
Many Thanks Jemima!
Where you have given data type type ?
Thanks
Thank you sir....thats very helpful and perfectly uderstood
Most Welcome!
You should make more videos. They are really helpful
More to come!
@@GauravSahani14 @manishrawatvlogs
That's so amazing! Impressive!
how to resolve i am getting unrecognized in null column in edit location and map chart is not loading?
When I tried to download tableau public, the software name was tableau desktop public , So which file has I just downloaded?
Wow.. thank you
Hi , Gaurav can I get the dataset which you are using
Okay I'll try getting that!
@@GauravSahani14 thanks Gaurav,also great explanation.
Glad it was helpful! Thanks Radha