
- Видео 177
- Просмотров 280 452
Statistics for Sustainable Development (Stats4SD)
Добавлен 10 июл 2016
Statistics for Sustainable Development is a not-for-profit, social enterprise that provides:
\t• Statistical and data management expertise
\t• Support on research designs and methodology
\t• Technical guidance related to collection and processing of data and information.
As a team of technicians and statisticians, we believe that our best work is done when supporting organisations and communities across the world that share our vision of a more sustainable future for all.
The videos on our channel aim to support students, researchers, and academics, and are accompanied by the free resources on our website.
Measurements and Joint Analysis
In this video, originally given as on online seminar, Ric Coe talks about measurement and collecting data with farmers, and discusses how they can be involved in the data analysis.
More videos on this topic:
ruclips.net/p/PLK5PktXR1tmMlefd36ZQKWCn00F_J5YjX
For our free resources, visit our website:
stats4sd.org/resources
Statistics for Sustainable Development is a not-for-profit, social enterprise that provides:
• Statistical and data management expertise
• Support on research designs and methodology
• Technical guidance related to collection and processing of data and information.
As a team of technicians and statisticians, we believe that our best work is done when supporting organisations an...
Просмотров: 51
Видео
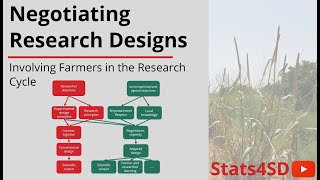

Negotiating Research Designs
Просмотров 595 месяцев назад
In this video, Ric Coe follows on from his previous webinar, this time looking at the outcome of negotiating with farmers. This video covers questions of balancing alternatives, deciding who is right, and how to compromise between requirements of both researchers and farmers. More videos on this topic: ruclips.net/p/PLK5PktXR1tmMlefd36ZQKWCn00F_J5YjX For our free resources, visit our website: s...
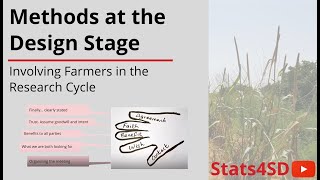
Methods at the Design Stage
Просмотров 445 месяцев назад
In this video, originally given as on online seminar, Ric Coe talks about choosing designs when involving farmers in the research cycle. The session focuses on the process of co-creation, considering what makes a 'good' design, and whether those rules should be changed for these situations. More videos on this topic: ruclips.net/p/PLK5PktXR1tmMlefd36ZQKWCn00F_J5YjX For our free resources, visit...
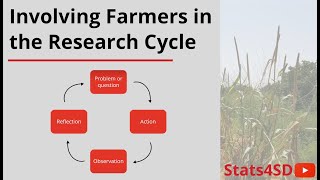
Involving Farmers in the Research Cycle
Просмотров 376 месяцев назад
In this video, originally given as on online seminar, Ric Coe talks about the methods used when involving farmers in the research cycle, and the potential considerations you need to take into account. More videos on this topic: ruclips.net/p/PLK5PktXR1tmMlefd36ZQKWCn00F_J5YjX For our free resources, visit our website: stats4sd.org/resources Statistics for Sustainable Development is a not-for-pr...
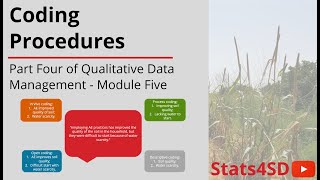
Coding Procedures
Просмотров 888 месяцев назад
This is the fourth video in our series on qualitative data management. This video defines what coding of qualitative data is and covers some different approaches to coding. Finally, we look at an example of a coding frame and structure for data analysis. Ver en español: ruclips.net/video/5CNNMeeRJ8E/видео.html Watch more videos in this series on qualitative data management here: ruclips.net/p/P...
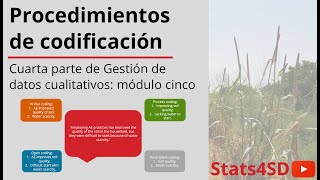
Procedimientos de codificación
Просмотров 1198 месяцев назад
Este es el cuarto vídeo de nuestra serie sobre gestión de datos cualitativos. Este video define qué es la codificación de datos cualitativos y cubre algunos enfoques diferentes de codificación. Finalmente, analizamos un ejemplo de marco y estructura de codificación para el análisis de datos. Watch in English: ruclips.net/video/XbbLk37P_dc/видео.html Vea más vídeos de esta serie sobre gestión de...

Procedimientos de transcripción
Просмотров 718 месяцев назад
Este video explica qué son las transcripciones y cómo realizarlas, analiza ejemplos de buenas transcripciones y considera cómo traducir transcripciones. Este vídeo es la tercera parte de esta serie sobre gestión de datos cualitativos. Watch in English: ruclips.net/video/Ya6Dz230BUk/видео.html Vea más vídeos de esta serie sobre gestión de datos cualitativos aquí: ruclips.net/p/PLK5PktXR1tmN-MtwQ...

Transcriptions Procedures
Просмотров 188 месяцев назад
This video explains what transcriptions are and how to conduct them, looks at examples of good and transcriptions, and considers how to translate transcriptions. This video is the third part of this series on qualitative data management. Ver en español: ruclips.net/video/iKOkekbmURo/видео.html Watch more videos in this series on qualitative data management here: ruclips.net/p/PLK5PktXR1tmN1ife2...

Sistemas de seguimiento de datos cualitativos
Просмотров 318 месяцев назад
Este es el segundo vídeo de esta serie sobre gestión de datos cualitativos. Cubre las características de las buenas prácticas de gestión de datos cualitativos, las características clave de los procesos de denominación de archivos cualitativos y explica los pasos de un sistema de seguimiento de datos cualitativos. Watch in English: ruclips.net/video/W4dyK2lCsdo/видео.html Vea más vídeos de esta ...
Qualitative Data Tracking Systems
Просмотров 558 месяцев назад
This is the second video in this series on qualitative data management. It covers the characteristics of good qualitative data management practices, the key features of qualitative file naming processes, and explains the steps of a qualitative data tracking system. Mira este vídeo en español: ruclips.net/video/uJjkyHkH6Mg/видео.html Watch more videos in this series on qualitative data managemen...
Papel de los datos cualitativos
Просмотров 198 месяцев назад
Este vídeo, el primero de una serie corta sobre gestión de datos cualitativos, explica el papel de los datos cualitativos y la investigación cualitativa. También compara el flujo de datos y las características de los datos cualitativos y cuantitativos. Watch in English here: ruclips.net/video/xaAqnMolLa0/видео.html Vea más vídeos de esta serie sobre gestión de datos cualitativos aquí: ruclips.n...
Role of Qualitative Data
Просмотров 598 месяцев назад
This video, the first in a short series on qualitative data management, explains the role of qualitative data and qualitative research. It also compares the data flow and features of qualitative and quantitative data. Ver en español: ruclips.net/video/GO3llFH6LfI/видео.html Watch more videos in this series on qualitative data management here: ruclips.net/p/PLK5PktXR1tmN1ife2PcM3B17r6jFmE5NX For...
Farmer Research Networks in Malawi: Socially Just Models of Inclusive Knowledge Co-Creation
Просмотров 689 месяцев назад
This video introduces the concepts and elements of agroecology, and discusses real examples from Farmer Research Networks in Malawai. This is a recording of a presentation which was originally given by Romina De Angelis at the UKFIET conference on Education for Social and Environmental Justice in September 2023. It also includes a presentation by Frank Tchuwa and Daimon Kambewa. For our free re...
Datos relacionales (Parte 2)
Просмотров 239 месяцев назад
Este vídeo tiene como objetivo ayudarle a identificar los motivos para agregar datos en un nivel superior o inferior y desarrollar su comprensión de las diferencias entre los diferentes tipos de fusión, vinculación y unión de datos. Para nuestros recursos gratuitos, visite nuestro sitio web: stats4sd.org/resources Mire más videos en este módulo: ruclips.net/p/PLK5PktXR1tmNIRFoObnTjbXve5cMLViHB ...
Rapid Experiments
Просмотров 5110 месяцев назад
This video goes into detail about research methods relating to rapid experiments or studies. We look at what they are, why they are valuable, how they can be done well, and when they are appropriate. Regarder en français: ruclips.net/video/VEYeygRj4U8/видео.html Ver en español: ruclips.net/video/wMPhxKxC5zk/видео.html For our free resources, visit our website: stats4sd.org/resources Statistics ...
Manor House Agricultural Centre (ENG)
Просмотров 4811 месяцев назад
Manor House Agricultural Centre (ENG)
Manor House Agricultural Centre (ESP)
Просмотров 2211 месяцев назад
Manor House Agricultural Centre (ESP)
Manor House Agricultural Centre (FRA)
Просмотров 3511 месяцев назад
Manor House Agricultural Centre (FRA)
Instalar y Cargar Librerias en R y RStudio
Просмотров 2,9 тыс.Год назад
Instalar y Cargar Librerias en R y RStudio
I would avoid editing and cleaning raw data prior to importing into R. You should be able to do so safely in R and with less risk of error. Copy and pasting in excel files can lead to unintended errors. There are packages and functions in R for doing so including janitor, tidyxl, openxlsx, readxl and others. If you are sharing a file with someone else it is best to edit and clean it in R (keep the original raw somewhere) and then export it as a .csv file. That is a pretty uniform format. If you are sharing with another R user you can use .rds or .rdata formats.
Excel spreadsheets are simply bad.
There are a couple built-in functions available in R for the Birthday Problem. Those are pbirthday and qbirthday. They come with the stats package.
I wonder how the frequency of birthdays is affected by c-sections which are quite common in the US.
I don't know why so many complain about for loops. They seem quite simple.
Good presentation 👏 👌
This was excellent! However, the link to the rmarkdown file doesn't work. Any chance of updating it?
This VDO is very useful but sound is unclear.
That is so descriptive and makes me understand so much
Thank you for this series. It has been very helpful. I liked your systematic approach and the constant repetition. that is how we learn.
Thank you 😊
Hola Alex, sabes algo sobre como corregir este error: Error in check.data(X) : Data are not matrix or data.frame. Saludos
How vould any apparatus logically acceptable psykotrsphy experiments with scientific proves.
Well done. Great video. I am curious, what software did you use to generate the animated presentation? Perhaps you should make a video about how you did it!! Thanks again.
This is great and insightful. The nodes, bridgers and influencers bit I like very much and it has helped me to understand network analysis. My question is: These nodes, clusters etc. are dynamic over time and across subject matter. How is this factored in?
thank you very much, what a useful lesson <3
glad we could help!
Excelente explicación, muchas gracias por la información, es de mucho valor.
Hi Sam, I am curious to hear your professional opinion about how to fit a model that I find to be challenging. I have measurements of oxygen consumption taken at 4 different temperatures for 520 eggs belonging to 80 species of insects. The goal of my model is to look at how a series of predictors like location, mortality ecc. influence the slopes of the lines that describe the change in oxygen consumption across the 4 measurement temperatures. Oxygen consumption intuitively increases with egg mass, measurement temperature and age of the egg. What I do not understand is how to make these slopes the dependent variables. If I first make a model like oxygen~egg mass+age+measurement temperature and then I use the slopes for each species as dependent variable in a model like slopes~site+mortality+ambient temperature is that correct? Or is that discourage because I am doing statistics on statistics? Conversely, if I build only one model like oxygen~egg mass+age+measurement temperature+site+mortality+ambient temperature is this model actually looking at slopes? Sorry for the long question but I find it hard to get a reasonable answer by myself. Cheers
Hi there - sounds like a fun challenge! I think the key thing you need to look into more is the concept of interactions. Specifically you are interested in the interactions between temperature and your other variables - there's a nice video here: ruclips.net/video/yJnHmCMb1q4/видео.html (not by me!). But it sounds like your main hypothes(e)s are related to whether there are interactions between temperature and your other 5 variables with how they relate to oxygen consumption - oxygen consumption is still going to be the dependent variable there. The other key thing as well is to understand if the trends you have would be approximately following a linear straight line within the observed range of values you have. e.g. It's pretty much universal that with ever increasing temperature you would not expect a continuously increasing response - at some point that relationship is going to break down. Depending on the shape of the relationship you might need to take logs, or perhaps look at a different way of approaching it by treating temperature as a categorical rather than a continuous variable. Or indeed it may be that within the range of temperatures you have a straight line is fine - the best way to assess this is to make sure you do lots of exploratory graphical analysis of your data before trying to fit any models - ggplot2 is great for this! As you only have 4 distinct temperatures I wouldn't want to try to fit any sort of more complex curve as it would likely be extremely overfitted, even if there was something that looked like a quadratic type relationship - treating temperature as a categorical variable in that case is likely a bit of a safer option. But either way what you need to be investigating is the size of the interactions between temperature and those other 5 variables.
I am really grateful for the time you took to explain your rationale about how to approach the matter. Thank you very much1 All of this was very useful. @@Stats4SD
Awesome stuff!
Thanks for the vid. At the minute six, I can see the intercept value (beta 0) at the summary is a high number completely different (-3.258) from where the line cross over the graph (y axy) . Is there a reason about that? Thank you
Nice question - this is something people often get confused with! The intercept value is not actually "the value of y where the line crosses the x axis" as is often taught. Instead it is "the value of y where x is equal to 0". In this particular model it is purely a mathematical constant to plot the line, and should not be interpreted, given it is so far outside of the range of observed values. In some cases it would make sense to draw your x axis starting at 0; but in this particular instance it would be totally nonsensical as the x axis relates to data recorded between 1640 and 1700. Taking our x axis all the way back to 0 would then squash all of our data into a very tiny corner of the plot. And extrapolating our model back to 0AD is even more stupid, in general we really should only extrapolate outside the observed range of values with extreme levels of caution. In this case it is pretty clearly a bad move since it is predicting a very large negative number of deaths due to a specific cause. But often extrapolation is not so evidently incorrect and can be a tempting thing to do, and then immediately be proved wrong when people want to predict the future, as we see later in the video!
Thank you so much. So many clarification right now. Very clear explanation. Helped me a lot.. Thanks
Great
Absolutely awesome tutorial on the foundations of ggplot2. Beyond any reasonable dought, ggplot is powerful and stands high among competitor packages and it is worthy investing your time to get grip on it, but plotly shines when it comes to interactive side, specially when the task is exploratory analysis. Of course you can zoom in and out with ggplot by changing the axis limit with the ylim() or xlim(). Thank you professor for the amazing tutorial!
This is awesome life savertutorial. Neaty and informtive. I always found hard to use the colour scales and had to go for the automatic option. I am aware of the critical importance of getting the colours right in vizualisations. From this tutorial it is now clear just like water under the bridge. I will be from now enjoying my favourite veredis scale. This colour scale accounts for discrete and continous variables type mapped to axis. Thank you a lot Professor for such an amazing tutorial
Thank you so much, it's really wonderful.
Wonderful series. I have found this content very useful! Nicely presented, easy to understand, free tools and resources,.. I am so impressed! THANK YOU
We are so glad you have found the series helpful!
i did a random word generator and looked it up on youtube and found this
Thank you so much indeed! You unlocked ODK locks of mine.
This has been my one stop course to ODK. Very simple, well crafted and high quality not to mention making all resources available including pptx. Thanks so much.
Glad it was helpful!
Hello, Could we have a session with you to ask about ODK? Thanks
Excellent. Very nice presentation. Clearly this can be extended to other phenomena. In similar vein have you considered doing a presentation on Benford's Law? I would find that quite interesting.
Ahh - the Provisional was an artifact - it did not get generated with the code I used.
Ah - that "provisional" comment is still there in the raw data, so I wouldn't call it an artifact. Check the bottom few rows of the raw datafile: www.metoffice.gov.uk/pub/data/weather/uk/climate/stationdata/oxforddata.txt. For any analysis purposes it's a totally inessential component since the * next to the numbers tell us the same thing, but does highlight again something to be careful with when reading in data to make sure you are getting what you expect in R! You should have seen a warning message when reading in the data using read_table() along the lines of "expected 7 columns actual 8 columns" It's one of the differences between read_table() and read.table(). read_table() will try and save time by scanning the first 1000 rows of the input to work out the data dimensions and classes, whereas read.table() will look at everything. In this case barely any difference in processing time since we only have just over 2000 rows but it can be a pretty substantial saving when dealing with much bigger data files. Since there is 7 columns for the first 2028 entries (and no header for the comment column), read_table() decides there must only be 7 columns in the data and skips the "provisional" comments. Because there are some rows with 8 columns, then read.table() decides there are 8 columns throughout the data and adds in missing values. If you wanted to force the input of read_table() to have all 8 columns you can explicitly give a column specification as part of the initial call: read_table(oxfordurl, skip = 7,col_names = c("yyyy","mm","tmax","tmin","af","rain","sun","comment"))
Under the yyyy variable I am not seeing Provisional. The data has probably been fixed since this video was recorded. That climate data appears to be updated at the end of each month.
This worked for me: read_table(oxford_url, skip = 5) using readr. And then I removed the first row (with the mismatched units).
This is classic messy data!
Well explained. Would a map function have worked here?
Yes - it definitely would! And I covered exactly that in the second part of the video: ruclips.net/video/ifjInVVy2NU/видео.html
Great Video. Thanks
Excellent! Thank you. Regards from Brazil.
Thanks Sam! You are a good teacher on statistical modelling in R. This is an amazing video...
Amazing
Good job. Thanks
this is amazing
It is a good presentation and really helpful,can you please share the link to the ppt
Superb video my friend
quite hilarious and informative
Clarity of the writing
This is an awesome R trainer!
Amazing video! All of this I have covered so many times and I wanted a refresher and this has made it much cleared than all my undergrad and now PhD studies. Thank you!
Very good, thank you!