
- Видео 61
- Просмотров 401 134
CWU Geography
Добавлен 14 апр 2021
Learn more about the Department of Geography at Central Washington University.
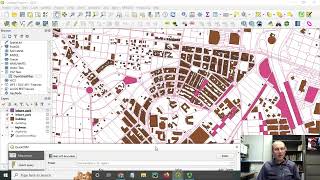
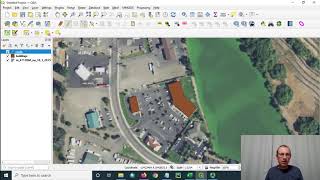
Creating an inset map in QGIS
Dr. Sterling Quinn shows how to use QGIS to create an inset map at a different scale from the main map.
Central Washington University offers a GIS Certificate program and a Bachelor of Science degree in Geography with a GIScience specialization. For more information, visit www.cwu.edu/geography/
Central Washington University offers a GIS Certificate program and a Bachelor of Science degree in Geography with a GIScience specialization. For more information, visit www.cwu.edu/geography/
Просмотров: 8 326
Видео


Creating an inset map in ArcGIS Pro
Просмотров 16 тыс.Год назад
Dr. Sterling Quinn shows how to use ArcGIS Pro to create an inset map at a different scale from the main map. Central Washington University offers a GIS Certificate program and a Bachelor of Science degree in Geography with a GIScience specialization. For more information, visit www.cwu.edu/geography/
Downloading OpenStreetMap data using QGIS and QuickOSM
Просмотров 27 тыс.Год назад
Dr. Sterling Quinn shows how to download OpenStreetMap data using the QuickOSM plugin in QGIS. Central Washington University offers a GIS Certificate program and a Bachelor of Science degree in Geography with a GIScience specialization. For more information, visit www.cwu.edu/geography/

GEOG 111 The Power of Maps
Просмотров 2162 года назад
GEOG 111 The Power of Maps is a CWU General Education course that explores the way maps influence society, while introducing students to mapping and location technologies.
Creating and editing a shapefile in QGIS
Просмотров 32 тыс.3 года назад
Dr. Sterling Quinn shows how to download an image, create a shapefile, and then trace (digitize) features from the image. This demo is performed in QGIS. Central Washington University offers a GIS Certificate program and a Bachelor of Science degree in Geography with a GIScience specialization. For more information, visit www.cwu.edu/geography/

CWU Geography 2021 end of year celebration video
Просмотров 1803 года назад
CWU Geography 2021 end of year celebration video

Choropleth mapping with Leaflet
Просмотров 7 тыс.3 года назад
Dr. Sterling Quinn gives a demo for beginners on how to adapt the Leaflet API's choropleth mapping sample code to your own data. The example used here is COVID-19 vaccination rate across Washington state counties, stored in a GeoJSON file. Central Washington University offers a GIS Certificate program and a Bachelor of Science degree in Geography with a GIScience specialization. For more inform...

Choropleth mapping with the ArcGIS API for JavaScript and a GeoJSON file
Просмотров 1,1 тыс.3 года назад
Dr. Sterling Quinn demonstrates for beginners how to make a choropleth map of vaccination rates by county using the ArcGIS API for JavaScript. This demo uses a GeoJSON file for the data. Central Washington University offers a GIS Certificate program and a Bachelor of Science degree in Geography with a GIScience specialization. For more information, visit www.cwu.edu/geography/

Creating popups with Arcade expressions in the ArcGIS API for JavaScript
Просмотров 5843 года назад
Dr. Sterling Quinn demonstrates for beginners how to add popup content when you click on a feature in the ArcGIS API for JavaScript. The content uses an Arcade expression to calculate and round a data value. Central Washington University offers a GIS Certificate program and a Bachelor of Science degree in Geography with a GIScience specialization. For more information, visit www.cwu.edu/geography/
GEOG 101 World Regional Geography
Просмотров 1173 года назад
Geography 101 World Regional Geography is a popular general education course at Central Washington University.
Central Washington University Geography online BA
Просмотров 743 года назад
Central Washington University Geography online BA
Geography 250: Resource Exploitation and Conservation
Просмотров 1513 года назад
Geography 250: Resource Exploitation and Conservation is a general education course that covers a broad array of environmental issues.
Geography 107 Our Dynamic Earth
Просмотров 3713 года назад
A short overview of Geography 107: Our Dynamic Earth. This is a popular general education course at Central Washington University.
Snapping in ArcGIS Pro
Просмотров 10 тыс.3 года назад
Dr. Sterling Quinn demonstrates how to use various snapping settings when editing vector data in ArcGIS Pro. Central Washington University offers a GIS Certificate program and a Bachelor of Science degree in Geography with a GIScience specialization. For more information, visit www.cwu.edu/geography/
Advanced vector feature editing in ArcGIS Pro
Просмотров 2 тыс.3 года назад
Dr. Sterling Quinn demonstrates various vector feature editing techniques in ArcGIS Pro, including moving, reshaping, tracing, merging, splitting, and cutting holes in features. Central Washington University offers a GIS Certificate program and a Bachelor of Science degree in Geography with a GIScience specialization. For more information, visit www.cwu.edu/geography/
Performing a spatial join in ArcGIS Pro
Просмотров 18 тыс.3 года назад
Performing a spatial join in ArcGIS Pro
Converting CSV to a shapefile in QGIS
Просмотров 21 тыс.3 года назад
Converting CSV to a shapefile in QGIS
Converting a CSV file to a shapefile in ArcGIS Pro
Просмотров 32 тыс.3 года назад
Converting a CSV file to a shapefile in ArcGIS Pro
Creating vector buffers in ArcGIS Pro
Просмотров 8183 года назад
Creating vector buffers in ArcGIS Pro
Performing a spatial query in ArcGIS Pro
Просмотров 7 тыс.3 года назад
Performing a spatial query in ArcGIS Pro
Dissolving and merging geographic features in ArcGIS Pro
Просмотров 1,5 тыс.3 года назад
Dissolving and merging geographic features in ArcGIS Pro
Making an elevation profile graph in ArcGIS Pro
Просмотров 16 тыс.3 года назад
Making an elevation profile graph in ArcGIS Pro
Enhancing a hillshade visualization in ArcGIS Pro
Просмотров 5 тыс.3 года назад
Enhancing a hillshade visualization in ArcGIS Pro
Performing a visibility analysis in ArcGIS Pro
Просмотров 8 тыс.3 года назад
Performing a visibility analysis in ArcGIS Pro
Performing a visibility analysis in QGIS
Просмотров 2 тыс.3 года назад
Performing a visibility analysis in QGIS
Making an elevation profile graph in QGIS
Просмотров 7503 года назад
Making an elevation profile graph in QGIS
Enhancing a hillshade visualization in QGIS
Просмотров 2,1 тыс.3 года назад
Enhancing a hillshade visualization in QGIS
How to create a similar map for sales across country? the higher sales are in such city, the darker will be the color of that city
Can I create segments using this method?
Video starts here 3:00
Again, amazing video, thanks so much!
Thanks, amazing tutorial!
Great video, thank you very much
Appreciate the detailed video
Clear and useful!
Thanks a lot
Thank you Sir! Very helpful tips!
very clear explanations, thank you respected
Thanks so much for this video!!!
why don't you just focus on the main part of the video
Did you say Psychopath or Cycle Path? 😁 Psychopath works!
how to adjust if you make a mistake?
Great Tutorial! Thank you so much!
saved me
very well-explained! Thank you so much Dr Schuelke!
thank you for sharing this video ,it helps me a lot
Thank you
Thank you!
Great explanation with examples
Thank you doc
Very explanatory. Thank you
Thank you! Worked for me :)
this is so much more complicated than in arcmap. congrats esri.
Really needed to find out how to change individual names on my map. Thanks for the help!
How can we get both vector tiles and style of OSM? In this way we can get the data but not style of it. I want to get all OSM vector tile for specific area with its own original style and make a little adjustment.
This is a great video. Thank you for sharing your knowledge.
Thanks for the useful video!
Thank you very informative
Thank you for the informative presentation. Where did you source the point data from?
Do you know if there is a website to download international maps outside of the US?
So helpful, thank you!
Thanks for sharing and providing some details that others overlooked!
get to the point
Where is arry button to change
You skipped the most important step.... This creates a separate legend window but does not actually add it into the map. How do you add it to the map? I tried save and also export and nothing happens (i.e. there is still no legend just to original map).
This was so helpful. Thanks for showing both ways.
Can I put a boundary shape file instead of the radius in the viewpoint function?
I have two questions, I did the visibility analysis, I need to know for each point the visible pixels and the total pixels and the maximum visibility percentage. If I crop the raster with a mask, can I know the same values as before?
Took me hours and I couldn't figure this out. Thanks for the video, it's so helpful 😅
Sir where did you get your DEM sir?
This is really helpful. Thanks for sharing your knowledge, man!
Hi - can you do a search SQL query so you can find all shops etc. in one area within QuickOSM?
Thanks a lot for producing this Video, it really helped me.
Im not sure how to get a cvs to shape file geo data base. which is the first step . Can you elaborate.? Or is there a seperate video ?
This does create a legend but converting to a drawing file does not seem to be the best practice. A live dynamic legend is more useful.
Thanks for your support
Thanks, great tutorial.