
- Видео 136
- Просмотров 319 290
UCLA Office of Advanced Research Computing (OARC)
США
Добавлен 10 янв 2014
The UCLA Office of Advanced Research Computing (OARC) is home to a team of experts who intensify and broaden data-driven research and technology capabilities at UCLA through consultation, training, and collaboration.
Transfer Learning Across Heterogeneous Structures for Large-Scale Structural Health Monitoring
Abstract: Urban infrastructure encompasses diverse systems, from residential buildings to critical facilities like power and transportation. Structural Health Monitoring (SHM) provides a framework to ensure the safety and continuity of these infrastructure systems by distinguishing between non-damaged and damaged states. The traditional methods for monitoring the health of such infrastructure face challenges in terms of scalability and generalizability. Emerging approaches, including Generative Adversarial Networks (GANs), Contrastive Learning, and Transfer Learning (TL), combined with SHM domain knowledge, address these limitations by enabling SHM models to function effectively without r...
Просмотров: 37
Видео


Panel Discussion on Applications of AI in Research Computing
Просмотров 81Месяц назад
The panel is led by the following new IDRE fellows (2024-2025) from various disciplines across the UCLA campus. Barbara Lopez-Doriga, Mechanical and Aerospace Engineering Claire Schollaert, Environmental Health Sciences Eulanca Liu, Radiation Oncology Mo Zhou, Mathematics Hesam Soleimani, Civil Engineering Tsukasa Yoshinaga, Head and Neck Surgery IDRE fellows initiated the event with introducti...

Navigating Climate Change Mitigation and Economic Transition Risks
Просмотров 1163 месяца назад
Speaker: Robert Fofrich, Ph.D. IDRE and UC President’s Postdoctoral Fellow Institute of the Environment and Sustainability University of California Los Angeles Abstract: Meeting international climate goals will help avoid extensive natural and economic damage globally, but achieving these targets requires the immediate decarbonization of the global economy and the early closure of critical infr...

New Platforms for Building Virtual 3D Environments: Replacement Platforms for Mozilla Hubs
Просмотров 993 месяца назад
October 9, 2024 @ 11:30 am - 1:30 pm Are you interested in creating and publishing 3D virtual environments on the Web? Would you like to be able to quickly spatially model multimedia assets? This workshop will introduce you to foundational techniques and resources which will enable you to produce WebXR (eXtended Reality) content. This spring, Mozilla sunsetted their WebXR platform, Mozilla Hubs...
Baseline DNA methylation profile predicts severe SARS-CoV-2 development trajectory.
Просмотров 1174 месяца назад
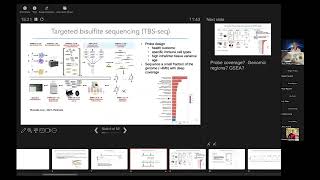
Speaker: Fei-Man Hsu, Ph.D. IDRE Fellow Department of Molecular, Cell, and Developmental Biology University of California Los Angeles Date: September 27, 2024 Abstract: DNA methylation is associated with pathogenesis and disease progression. The IMPACC cohort includes hospitalized COVID-19 participants with five respiratory illness trajectory groups (TGs) according to the prognosis during acute...

Forecasting and Interpolation for Learning Physical Simulation over Meshes
Просмотров 965 месяцев назад
Speaker: Xiao Luo, Ph.D. IDRE Fellow Department of Computer Science University of California Los Angeles Abstract: This talk discusses the problem of learning-based physical simulation, a crucial task with applications in fluid mechanics and aerodynamics. Recent works typically utilize graph neural networks (GNNs) to produce next-time states on irregular meshes by modeling interacting dynamics ...

How Can One Use Machine Learning and High Performance Computing for Humanities Research?
Просмотров 1675 месяцев назад
By Benjamin Winjum, Project Scientist, OARC December 7, 2023, 10-11AM via Zoom The application of machine learning (ML) and high performance computing (HPC) to humanities research holds tremendous potential, but there are significant challenges to developing a community of experts that can work together at this intersection of topic and technique. HPC experts may not have the background necessa...

Panel Discussion on Harnessing High-performance Computing across STEM Disciplines
Просмотров 627 месяцев назад
The IDRE Early Career Researchers group's panel is a discussion on how high-performance computing (HPC) is used across STEM disciplines. It is led by the following new cohort of IDRE fellows (2023-2024) from various disciplines across the UCLA campus. Robert Fofrich - Institute of the Environment and Sustainability Fei-man Hsu - Department of Molecular, Cell, and Development Biology Alec Linot ...

TimeAutoDiff : Combining auto-encoder and diffusion model for time series tabular synthesizing
Просмотров 3827 месяцев назад
Speaker: Najoon Suh, Ph.D IDRE Fellow Department of Statistics and Data Science University of California Los Angeles Abstract: In the work to be presented, we leverage the power of latent diffusion models to generate synthetic time series tabular data. Along with the temporal and feature correlations, the heterogeneous nature of the feature in the table has been one of the main obstacles in tim...
Mitigating climate change drivers and associated risks of surpassing lower emission targets
Просмотров 2898 месяцев назад
Robert Fofrich, Ph.D. IDRE and UC President’s Postdoctoral Fellow Institute of the Environment and Sustainability University of California Los Angeles Abstract: Lower climate change mitigation pathways require large and swift reductions in anthropogenic CO2 emissions worldwide, a substantial portion arising from fossil energy sources utilized in electricity generation. Thus, stabilizing global ...
2024 International Humanitarian Mapathon MariahTso Keynote
Просмотров 968 месяцев назад
The 2024 International Humanitarian Mapathon kicks off a remarkable keynote from Mariah Tso. She set the stage for our mapping activities and why we map. Her talk also helped put into context the student protests in support of Gaza that were happening all across the United States as the mapathon began and continued. This was especially meaningful as two of our organizing schools - USC and UCLA ...
Using Topological Data Analysis to characterize fluctuations in brain activity patterns
Просмотров 31510 месяцев назад
Speaker: Prof. Manish Sagger Tashia and John Morgridge Endowed Faculty Scholar in Pediatric Translational Medicine, Stanford Maternal & Child Health Research Institute Assistant Professor, Department of Psychiatry & Behavioral Sciences Principal Investigator, Brain Dynamics Lab Stanford University School of Medicine Abstract: Understanding the neurobiological underpinnings of psychiatric disord...
Interacting Dynamical System Modeling for Science: Construction and Generalization
Просмотров 12310 месяцев назад
Abstract: Many real-world systems such as disease transmission, molecular dynamics, and spring systems can be considered as multi-agent dynamical systems, where multiple objects interact with each other and exhibit complex behavior along the time. In this talk, I will discuss my current research on interacting dynamics system modeling for scientific problems, especially focusing on model constr...
Introduction to Meta-analysis using Stata
Просмотров 3,1 тыс.10 месяцев назад
This workshop introduces the ideas used in meta-analysis, including how to collect and organize data, how to run a basic meta-analysis, and how to interpret the output.
Annotate Digital Imagery: Theory, Applied Practice, and Tools for Research
Просмотров 8610 месяцев назад
Annotate Digital Imagery: Theory, Applied Practice, and Tools for Research
Computational approaches in clinical epigenomics
Просмотров 11811 месяцев назад
Computational approaches in clinical epigenomics
Introduction to Network Analysis Methodologies and Tools
Просмотров 2,1 тыс.11 месяцев назад
Introduction to Network Analysis Methodologies and Tools
Contextualizing Collections: Intro to Immersive Annotated 360 Virtual Tours with Adobe Captivate
Просмотров 18311 месяцев назад
Contextualizing Collections: Intro to Immersive Annotated 360 Virtual Tours with Adobe Captivate
Data-driven prediction of vortex dynamics with hierarchical graph neural networks
Просмотров 407Год назад
Data-driven prediction of vortex dynamics with hierarchical graph neural networks
Epidemic Model Guided Machine Learning for COVID-19 Forecasts
Просмотров 391Год назад
Epidemic Model Guided Machine Learning for COVID-19 Forecasts
Comprehensive Lexical Resource for English Using Bayesian Deep Learning and Missing Data Methodology
Просмотров 93Год назад
Comprehensive Lexical Resource for English Using Bayesian Deep Learning and Missing Data Methodology
ECR OpenScience workshop March 24, 2022 - part 1
Просмотров 81Год назад
ECR OpenScience workshop March 24, 2022 - part 1
Unsupervised Discovery of Ancestry Informative Markers and Genetic Admixture Proportions
Просмотров 419Год назад
Unsupervised Discovery of Ancestry Informative Markers and Genetic Admixture Proportions
High Performance Machine Learning Using Scikit-Learn
Просмотров 344Год назад
High Performance Machine Learning Using Scikit-Learn
Intro to Julia: A fast dynamic language for statistical computing and data science
Просмотров 440Год назад
Intro to Julia: A fast dynamic language for statistical computing and data science
Dynamic multivariate task fMRI analysis using Partial Least Squares in Matlab
Просмотров 434Год назад
Dynamic multivariate task fMRI analysis using Partial Least Squares in Matlab
Hi, my name is Clara Fernández. I am currently doing my a master's degree in Egyptology, and I have a special interest in Karnak and its developments over time. I tried to download the VSim Digital Karnak prototype, but I can't seem to find it. I was wondering if you could provide the file. Thank you so much!
been doing this for a while as coder. It is simple since everything is comp science. HOW DO I START EARNING, HOW DO I START A CONSULTANCY
pound the life outta me bro
Great video!!!
Excellent Video
Excellent. Very helpful
Fantastic walk through!
Fantastic! Thanks for sharing! :)
Hello! Thank You very much! Very helpful video! Can I get codings used in this course? It would be very helpful for me. Thanks in advance!
Thank you for the wonderful tutorial. Yoh made it easy to follow along and work through the lab. I may have missed something, but I found that within the style.css code I needed to add a sidebar statement listed below. Without this, the sidebar would draw under the footer on the webpage. This may also just be because of an update to how css is read, but hopefully this helps anyone having similar issues. .sidebar { grid-area: sidebar; padding:10px; background-color: rgb(175, 175, 175); }
There some inaccuracies in the dummy variable discussion. Categorical variables have levels - not categories . To be more precise these are factor variables. This distinction is made later in the lecture but should have made from the outset to avoid confusion.
Nice and clear overview.
Thanks.
can i get a link to the do file. cant see it
you can find all the files using the link in the description of the video (I managed to do it a few days ago)
'We must mitigate the climate problem...' You're what we call an educated idiot. There is a CO2 dearth at this time. NOT a 'climate change' induced by human activity. SMH
At 57:39 you say "make sure you are okay with setting the scale of that item". Lets say all items are measured on the same scale (likert 0 to 5). How do we assess whether we are okay with setting a particular item as the reference item? Spontaneously Im thinking that in the case of a likert scale where all items are on the same scale, we would atleast want to ensure that the item that is used as the reference item is an item where each answer option (0, 1, 2, 3, 4, 5) has been used "equally" often? For example, using an item where 4 was not chosen by a single respondent - seems like a bad item to use as a reference item? Is this at all true?
In 2:03:19, he said "I am just showing you the real world", I died.
Thanks for the informative video. For time-varying Cox model (2:32:50), do we still need to check PH assumption for the time-varying covariate? Thanks!
Can you please suggest how to perform survival analysis for paired data for longitudinal studies.
Great explanation. Has anyone ever thought of using these ideas for a language model? It could have continuous learning built in, due to the Bayesian Approach.
Excellent. Do you have a video for latent variable means comparison please?
Thanks for your very educative talks. I found very helpful.
General comment Prof. , @9.07, the real part id the natural frequency and wi is the growth rate of the eigenvalue problem. Thats the general convention.
Excellent teaching, thank you very much
Provide simulation with macine learning matlab etc
Definitely, the best R tutorial I have ever come across on RUclips! Good stuff!
100% This video is great
Thank you for such a detailed introduction to SEM. I have a question - at 46:18 the model is called a "saturated model" because the df = 0. However I have been reading that a "saturated model" occurs when there are the same number of parameters as there are data points. In this case, the model has 5 parameters and 500 data points. Is it still a saturated model then?
very insightful, I would wish to know how to use these commands after doing missing imputation with MICE
I have learned so much, gracias!
how do we get the value of the latent ? not the variance but the value
Thanks a lot! Greetings from University of Adelaide.
Fabulous Lecture
YOUR THE BEST, YOU JUST SIMPLIFIED EVERYTHING THANKYOU SO MUCH PROFESSOR
great video! Thanks. What do you think of using the estimation method DWLS instead of ML for ordinal items (such as those in the video "strongly disagree to strongly agree")? I have just read a paper (Reimann et al. 2024) where they used DWLS in a 2-factor CFA and got a great RMSEA (0.01). Their rationale was that the responses are ordinal and not continuous. Interestingly, I could run the same data set with ML and got an RMSEA = 0.13. Obviously a big difference. In papers, authors often do not even mention their estimation method.
Wow, this is outstanding! Will it be possible to do similar in R program
Wow..what a tutorial Thank you so much❤❤
For a complete novice to Mplus this was a great introductory tutorial. Thank you.
I am in an intermediate statistics and research course for my doctoral program. I began reading Hayes and found myself dissociating with glazed stares. This workshop has provided an informative path to at least begin to consume the material with some understanding. Your assistance with downloading the PROCESS macro was also very helpful. I hope to find moderation and conditional process analysis workshops from this source as well. Thank you very much!!
Matlab? Mathematica? Maple? Python? R? Thanks.
Once I save the folium html, after two days, the interactive visualization stops to display. What could be the problem?
Thank you so much. Very helpful!
Great video thank you!
Thanks for the great tutorial. At 1:51:35, is the wt.loss also by the time of beginning the study (treatment), like the age variable? Thanks.
My rmse is more than 0.8
My cfi is 1 and rmse NA
Thank you very much for an excellent lecture on CFA. Just a small comment/correction on the very final exercise: the Test statistic for the User Model, is 554.191. In your solution, it is 562.790. and the Degree of Freedom is 20, not 21. By putting these numbers in the formula, we get the correct CFI, which is 0.871 (rounded).
The 'li' syntax didn't work for me. It returned errors
Still can't believe this is free to watch for everyone. Thank you so much.
So much rambling in this presentation. The content gets lost in it.
Great video! Great delivery and insights!