
- Видео 47
- Просмотров 1 290 996
Erich Goldstein
Добавлен 2 янв 2013
Videos providing instruction in mathematics, statistics, and statistical software.
Opening Excel Files in StatCrunch
Learn how to take an Excel file from your computer and open it up in StatCrunch.
Просмотров: 709
Видео


Choose the Test - Registry Exam Preparation
Просмотров 5869 лет назад
Using the methods discussed ruclips.net/video/UaptUhOushw/видео.html determine which is the correct statistical test to use in this situation.

Choose the Test - Cesarean Section Expectation
Просмотров 6519 лет назад
Using the methods discussed ruclips.net/video/UaptUhOushw/видео.html determine which is the correct statistical test to use in this situation.

Choose the Test - Vaccine Effectiveness
Просмотров 1,8 тыс.9 лет назад
Using the methods discussed ruclips.net/video/UaptUhOushw/видео.html determine which is the correct statistical test to use in this situation.

Choose the Test - Knee Replacement Recovery
Просмотров 6919 лет назад
Using the methods discussed ruclips.net/video/UaptUhOushw/видео.html determine which is the correct statistical test to use in this situation.

Choose the Test - Pressure Ulcer Education
Просмотров 8199 лет назад
Using the methods discussed ruclips.net/video/UaptUhOushw/видео.html determine which is the correct statistical test to use in this situation.
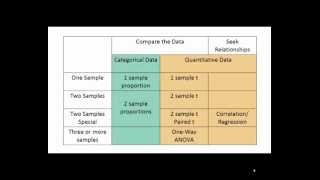
Choosing a Statistical Test
Просмотров 800 тыс.9 лет назад
In common health care research, some hypothesis tests are more common than others. How do you decide, between the common tests, which one is the right one for your research? Thank you to the Statistical Learning Center for their excellent video on the same topic. ruclips.net/user/rulIUAN0U3w

M17 Five Number and Boxplot
Просмотров 3,3 тыс.10 лет назад
Find the five number summary for a set of data, and create a boxplot to see it visually.

M17 Power Analysis Paired t
Просмотров 3,8 тыс.10 лет назад
Find the sample size for an experiment testing a difference between paired means using power analysis in Minitab 17.
M17 Samples from Columns
Просмотров 10 тыс.10 лет назад
Learn to use Minitab 17 to take a random sample of data from a column of data.
M17 Power Analysis 2 SD
Просмотров 3 тыс.10 лет назад
Find the sample size for each sample in an experiment comparing the standard deviations (or variances) of two populations using power analysis in Minitab 17.
M17 Sample Size for Estimation
Просмотров 24 тыс.10 лет назад
Find the sample size required to estimate population parameters using Minitab 17.
M17 Normal Distribution by Graph
Просмотров 10 тыс.10 лет назад
Use Minitab 17 to solve problems that require application of the normal distribution.
M17 Power Analysis 2 Means
Просмотров 4,9 тыс.10 лет назад
Find the sample size for each sample in an experiment comparing the means of two populations using power analysis in Minitab 17.
M17 Paired t Test
Просмотров 6 тыс.10 лет назад
Perform a Paired t Test to compare the means of two sets of dependent data in Minitab 17.
GOOD VIDEO REAL G
Thank you very much. you really make it easy for me to know how to choose the appropriate statistical test.
such a valuable video!
Nice video
Nice information
Nice explanation
Nice simple presentation
Thank you sir
Namste
What is 1 sample proportion and two sample proportion test called?
Good morning Erich, How I can get your data in those VDO?
Very clear, concise and nformative video! Great examples. Easy to follow. Thank you!
your explanation is great
It is just marvellous talk. You are genius teacher. First time I felt to subscribe the channel
Very informative session on basics of statistics.
Informative and useful
Good 👍 video
Very nice information video 🎉🎉🎉
Good information
Thanks sir statistics test discussion
Excellent 🎉
Great lecture
Excellent
Best Explanation
Very nice explanation. ..
Very Informative
Very difficult to understand
Wow. I just made a huge connection between a bunch of things I've learned by watching this video. Thank you so much.
I am really confused, may you help please, I am looking for a complication associated with one disease. my problem is how to calculate sample size by which test? the concept is that: how many of the sample subjects will be having that complication? Thank you
Why is a pain scale not considered categorical?
This lecture was phenomenal
Wow... Thanks a lot, man❤.
Not a health student but the information in this video is so much valuable and it actually helped me a lot. Thank you.
Thank you very much for this. I am not good with statistics, yet it was very easy to understand.
very helpful . thankyou
The best explanation of statistical tests ever. Good Job 👏👏👏
I've watched thousands of hours of videos on various learning topics, and by far the way you present and articulate the material is among the best. Clearly you know your subject and you have a passion for imparting that knowledge upon others. Thank you!!!
Your visuals are EXTREMELY helpful & clarifying. Also, super thanks for having a slightly slower rate of speech than many statisticians, also actual examples worked into every single level or type of test. VERY helpful.
Why there is no question about the distribution of data?
Thanks for making this video! Very helpful
Thank you, Sir. That was awesome!!!
Whats a Good sample size for a pilot study to Estimate the S.D?
Fantastic video. Would you please provide this ppt? Much appreciated
thankyou very much for this video! i have to compare alcohol consumption on few memory test variables ( about 5 variables) which test would i use? can i use indipendent sample t test 5 times or 1 way ANOVA ? thankyou in advance
I just love the subtle joke about adding and subtracting :D. To the point and well-clarified.
lol, great video
I really appreciate the ease with which such a complex topic has been explained. It really shows that you know this topic very well. And you also are very good at simplifying complex things. Kudos ! Thanks again. 😇 However I still have a doubt, if I have a two group special, categorical data with comparison as my objective which tests should I use ?
god send. thank you erich
Thank you for this video
I would help if you could share the data set to follow along.