
- Видео 7
- Просмотров 27 741
Ninad Barbadikar
Добавлен 25 мар 2021
Welcome to my channel where I will be uploading tutorials on Tableau from time to time, subscribe to stay tuned!
Creating basic football data visualisations using Tableau
Hey everyone! Hope you're all staying safe and well,
I'm back after a long break on this channel and after a really positive response on a poll, this is the first of a few videos that I'll be putting out which are basically video explainers on my Tableau Tunnel series on Medium where I've created guides for different applications of football data on Tableau.
Download Tableau Public here (Free for everyone) - www.tableau.com/en-gb/products/public
(Or)
Download Tableau Desktop here (Free for Students) - www.tableau.com/en-gb/products/desktop
This video today is for those of you who are absolute beginners and want to learn how to create viz using Tableau whilst also avoiding code that you find ch...
Просмотров: 8 574
Видео


Combining worldfootballR and Tableau for football visualisations
Просмотров 2,4 тыс.2 года назад
Hey everyone, Hope you're all staying safe and being well. Today's video is just a run-through of how you can improve your workflow of producing visualisations on Tableau by using R to collect data from Fbref, Understat or Transfermarkt. It's all in the video which is a bit long and a little awkward haha, but I hope I've made some sense there. Please make sure to check out Jason's work here - t...

My first EFL Matchday Experience - Port Vale v Leyton Orient
Просмотров 1,8 тыс.3 года назад
Hey guys, This is just a little vlog I put together of my experience of watching an EFL League Two official senior men's match between Port Vale and Leyton Orient at Vale Park. It was a game full of thrills and the ending was brilliant. It was a memorable first live game for me and one that I'll never forget. A big thanks to Staffordshire University for this opportunity. I attended the game to ...

Creating xG Trendlines on Tableau using moving averages - Tableau Tunnel
Просмотров 1,5 тыс.3 года назад
Hey everyone! It's been a while! Hope everyone is staying safe and doing well. Today's Tableau Tunnel tutorial is a brief look at how you can create xG trendlines on Tableau using moving averages. I've also briefly explained how you can collect data using the WorldfootballR package from Jason Zivkovic (@jaseziv on Twitter) Here's a link to his profile - jaseziv Let me know in the co...

Creating Shot Maps, Pass Maps in Football using FC Python Video Coder for Tableau
Просмотров 9 тыс.3 года назад
Hey guys! Hope all of you have been staying safe and keeping well. Glad to finally be able to share this tutorial on creating different football viz using FC Python's excellent video coder app. I've explained how you use the app itself and then export the data and create your viz using Tableau. Link to the app - fcpythonvideocoder.netlify.app/ FC Python Twitter - FC_Python Their Pat...
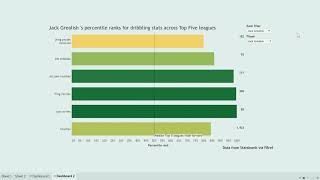
Introducing player percentile rank charts in Tableau - Tableau Tunnel
Просмотров 3,7 тыс.3 года назад
Hey everyone, Hope you're all doing well and staying safe. It's been a while since I did this, so I hope you'll forgive my many lapses but I hope that at the end of the video, I do help you get from point A to B in learning how to calculate player percentile ranks within Tableau. Happy vizzing!

Introducing Lollipop graphs using dual axis in Tableau - Tableau tunnel
Просмотров 1,1 тыс.3 года назад
Hi there, Hope you guys are doing well and staying safe. Welcome to the very first video tutorial of the Tableau Tunnel series - today we're looking at lollipop graphs. I've introduced the concept of dual-axis in this video which will be important for you to use in future tutorials so I've tried to simplify that for you in this video. Let me know in the comments if you've had any trouble at all...
Hey all, many thanks for the support that you guys are showing by still consuming my Tableau tutorials here! Just FYI, it has been a while since I made these videos and since last year, the website fbref runs a different structure to it's tables where exporting the data in CSV format is no longer possible. I would recommend that you go check out my other videos where I show you how to combine Tableau and R in an easy way to create simple vizzes. Apologies for the inconvenience and I hope you still picked up something useful from this video!
Awesome
please upload more, this is amazing
how caan this be done in power bi?
Great video Ninad Question - When I apply my rank filter, I am only able to select one name out of my whole data set?? Any ideas?
IF [Table Name] = 'Sheet1.xlsx' THEN [X] ELSE [X2] AND Don't work Is it helpful
It's "END" not "AND" bro!
This video is amazing Ninad I was just wondering for this format is there a way for one of the stats for example goals conceded for a goalkeeper where less is better how do you adjust for this?
when converting the file to excel the data is not organised in the file. Is it due to mac. is there any alternatives ?
Hello Ninad, great video you made, also excellent tips, I am a student of a Master in Big Data Sports oriented in football, and use this tutorial of yours and I found it fascinating, I just have a question: At the time of entering the link of the drive where I download the link of the pitch file there is another one of a goal where I assimilate that it is for shots on goal, is there any tutorial where I can see its use in tableau? 😁😀
Very helpful, this is what I have been looking for. Thank you so much😉
Curious to know if the same - or close to the same can be done through excel?
@ninadbarbadikar really enjoyed this video - would appreciate more content from you soon. Great work.
Thanks a lot for this tutorial! Really helpful.
Hi, I keep receiving an error message when I do the NEW X, NEW Y statement. It says 'expected type integer, found string'. How do I get past this? Thanks :)
Error in open.coonection (x, "rb") :HTTP error 403. , how fix
20:29 is that possible in powerbi?
Same question here. If we can do that in Powerbi would be great
@@JP21xD yes
@@JP21xD yeah it is actually used in some sport clubs. A guy called ray created a lot of these data Viz in the Microsoft community.
Thank you so much. I was really struggling to get my head round it. You've helped me out lots. Keep up the good work 😀
Hey Ninad, thanks a lot for sharing full process. That is really helpful.
Thank you for this video! Subscribing and checking the rest of the videos!
Very good work from you. Big W
Thanks a lot Ninad. This helped a lot
Keep up the good work, brother!
This is very useful, thank you ninad
Nice video mate 👍
nice video
Thanks for this, used to make xA trendline for a ISL player! Would recommend using a mic sometimes your words are not audible.
Superb bro :) keep it going!
What a game to pick for your first! Can you attend every home match please?
Great video mate! You’re welcome back to Vale Park anytime🤝🤝🤝
Nice one mate.👍
This is so cool! Very happy for you :)
Great experience for you and great game to pick as your first
Certainly picked a good game to start with, glad we were able to give you something to talk about. Excellent experience for you and great first effort too
What a king ! Great vlog
What a game you picked for your first!
Very good take on the game
Inspiration!! As someone who aspires to be a football journo, this was absolutely brilliant.
Thanks for the post...
Nice ....could you upload more tutorial of tableau
tableau deez nuts
Hey Ninad! Thanks for this. One quick question/feedback/suggestion, since I could not find the solution easily through Google. Is there a way we can have dotted vertical lines to show different seasons for something like this? It might help show any important points of regression/progression.
Hey Sarthak, Yes you can do that and there's a couple of ways you can go about it. But what you can do is use the INDEX() function to generate random numbers assigned to each of the dates and then plot index vs your npxG field, make sure that you have date on detail because index is a calculated field which will take date as a reference.
@@ninadbarbadikar4517 Super! Sounds great. I'll try this out. Thanks man!
Hi! Amazing tutorial! Is there any way to combine line charts with dots? Was just wondering if it was possible to have for example passes/drives with recoveries on the same one. Thanks!
brilliant tutorial , keep up the great job man 👍 , this channel deserve more sub 👍
Also can u please do a tutorial about how to create heatmap and how to implement pass types,shot types etc into the heat map ? :)
Hi, wonderful video. Learned a lot. Can you please post the template one which you showed for directions
Excellent work as always Ninad!
Waiting for more!!
Thank you so much for making this!!! If possible can you make some vids on ISL
Fantastic work !!
Thank you!!