
- Видео 22
- Просмотров 175 486
Kapil Dev Adhikari
Индия
Добавлен 24 дек 2018
Tutorials and Tips on QGIS, Remote Sensing (RS) and Data Analysis.
This channel was founded with a mission to enable everyone to learn and use modern geospatial technologies.
I am a strong believer in open-source, open-data and open-learning materials. My interest in automating GIS workflows led me to learn coding and I enjoy working with Google Earth Engine, Python and QGIS.
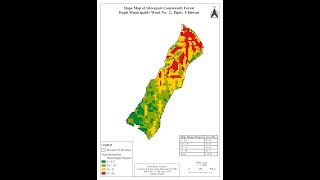
Slope Reclassification Process in QGIS #Step-3: Finalizing Reclassified Slope Map
Slope maps are intended to fill in the gap regarding how steep an area is. Typically, we can measure this as either a degree value from one raster cell to the next of the Digital Elevation Models (DEMs) or DTM or as a percent/ratio.
Просмотров: 479
Видео

Slope Reclassification Process in QGIS #Step-2: Reclassified Slope Map Preparation
Просмотров 2895 месяцев назад
Slope maps are intended to fill in the gap regarding how steep an area is. Typically, we can measure this as either a degree value from one raster cell to the next of the Digital Elevation Models (DEMs) or DTM or as a percent/ratio.

Slope Reclassification Process in QGIS #Step-1: Map making
Просмотров 1615 месяцев назад
Slope maps are intended to fill in the gap regarding how steep an area is. Typically, we can measure this as either a degree value from one raster cell to the next of the Digital Elevation Models (DEMs) or DTM or as a percent/ratio.

Tree Volume Analysis System Nepal
Просмотров 926Год назад
This application (algorithm) is developed on Python, Qt and Pandas modules. It is based on "Volume equations and biomass prediction of forest trees in Nepal (Sharma and Pukkala, 1990) and वन नियमावली, २०७९". It has a beta version of window interface with many widgets to add but user-friendly, easy to use and perform analysis of millions of data within few seconds efficiently. If you have any qu...
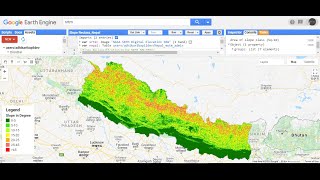
Reclassify Slope in Google Earth Engine using DEM
Просмотров 4,5 тыс.3 года назад
Create a slope raster using 30 m SRTM DEM and then reclassify it based on range of values (degree) in order to estimate what type of slope has the biggest coverage (area). A Digital Elevation Model (DEM) file stores elevation data that can be used to extract slope parameters and to perform surface analysis. GEE script link: drive.google.com/file/d/19ZlaxLuYiBueepczPMYNaWMc_GkDcIqC/view?usp=sharing

Esri 10-meter LULC in Google Earth Engine
Просмотров 2,8 тыс.3 года назад
ESRI 10-meter 2020 Global Land Use Land Cover from Sentinel-2: This layer displays a global map of land use/land cover (LULC). The map is derived from ESA Sentinel-2 imagery at 10m resolution. It is a composite of LULC predictions for 10 classes throughout the year in order to generate a representative snapshot of 2020. This map was produced using machine learning by Impact Observatory for Esri...

Divide a polygon into equal parts or equal-area polygons using QGIS 3.x
Просмотров 16 тыс.3 года назад
QGIS 3.0 to 3.14 π (qgis.org/en/site/forusers/download.html) 1. Plugins needs to be installed (Manage and install Plugins...): Polygon Divider QGIS Plugin (Now available for QGIS 3) 1.1. Polygon Divider: (By Area method or By Number method) This plugin divides polygons into smaller 'squarish' polygons of a specified size. Polygon Divider takes a polygon and efficiently divides it into a number ...
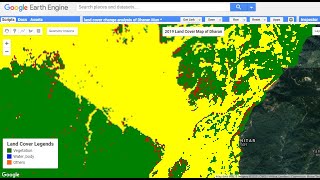
Land Use Land Cover Change (LULCC) between 2001 and 2019 in Google Earth Engine (Study Area: Dharan)
Просмотров 45 тыс.4 года назад
Classification and Regression Trees (CART): Machine learning technique in Google Earth Engine. In this tutorial learn how to: 1. Define sample points to train a classifier. 2. Classify the training points into different classes (Urban, Vegetation, Water, and Other Land) 3. Merge the four geometry layers into a single Feature Collection. 4. Sample the composite to generate training data. Note th...

Upload Shape files/Geo-tiff files in GEE Assets and filter to ROI
Просмотров 7 тыс.4 года назад
This gives you options to upload GeoTiff, Shapefiles, CSV Files, or Image Collection or Folder. Navigate to your folder and upload the files that you want. It might take a while to upload your file. Once your files are uploaded to Assets, you can import an asset to your script by hovering over the asset name in the Asset Manager and clicking the arrow_forward icon. After that, you can filter th...
Mother Trees Selection and Data Processing Tool for SFM Nepal @QGis 3.6x
Просмотров 6994 года назад
To download the Algorithm tools, open the link below: (Irregular Shelter Wood Silvicultural System; Supports only on QGIS 3.6 or later versions): 1. Mother Trees Selection and Data Analyze Tool: drive.google.com/file/d/1SKJVaf4EQS6YIfgy6zvNKF3enyfhXGCz/view?usp=sharing 2. Stratified Systematic Sampling Plot Design: drive.google.com/file/d/1KHkQpPCXZoYNRKaIRCXzq72QceStQIdv/view?usp=sharing 3. Fo...
Slope Analysis/Reclassify from a DEM in QGIS 3 (in degrees/percentage)
Просмотров 48 тыс.4 года назад
Reclassification of a Slope/Raster in QGIS 3 1. At first load your DEM Raster to Qgis canvas/screen, 2. If your Input DEM Raster is on 'Degree/WGS_1984' then, Reproject your DEM Raster layer's EPSG from Geographic CRS 'Degree/WGS_1984' to Projected CRS 'Transverse_Mercator/WGS_1984_UTM_Zone_..N' #[Raster-Projections-Warp 'reproject'] 3. Now, goto Raster-Analysis-Slope, 4. On processing toolbox,...
Forest Fire line designing GIS tool/algorithm for Forest Management
Просмотров 4545 лет назад
Design forest fire-line. To inner compartments and outer boundaries of the forest area. Qgis Python Algorithm/tool Click the link to download: drive.google.com/file/d/1eIT6tcaR9mtPEID3Wp2XvgXRIC_gHkXC/view?usp=sharing
Python Processing Scripts (add&run) on Qgis 3.x
Просмотров 1,9 тыс.5 лет назад
Add python Processing Scripts and run on Qgis 3.6 1. Spreadsheet2One.py drive.google.com/file/d/1aPNAgzqbAMbmvXIWCIwSDktMmZ5HAsK8/view?usp=sharing 2. Systematic Sampling Plot Design.py drive.google.com/file/d/1D84TL5nKo4VaLthxszx29AyRvo23Wd6i/view?usp=sharing
Map layout design in Qgis
Просмотров 3,7 тыс.5 лет назад
Print Composer (Export map as Image) on QGIS With the Print Composer, you can create nice maps and atlases that can be printed or saved as PDF-file, an image, or an SVG-file. This is a powerful way to share geographical information produced with QGIS that can be included in reports or published. Background music: ruclips.net/video/K4Z06ZtTrNI/видео.html
Block Division (split polygon) in Qgis
Просмотров 4,6 тыс.5 лет назад
GPS XY data import and Polygons' Block Division in Qgis (Simple ways) 1. Goto Plugin toolbar, 1.1. Manage and install Plugins (In this tab you can change the settings for the plugin manager.) and Check the 'Show experimental plugins' checkbox and Reload repository tab. # Plugins list to be installed. a. Spreadsheet Layers b. Points2One c. Calculate Geometry d. Digitizing Tools e. GEarthView f. ...
Stratified Sampling of Forests using Qgis
Просмотров 3,9 тыс.5 лет назад
Stratified Sampling of Forests using Qgis
Sample Plots Design and Plotting in QGIS Forest
Просмотров 9 тыс.5 лет назад
Sample Plots Design and Plotting in QGIS Forest
Shapefile or vectors to google earth in just one click in Qgis
Просмотров 3485 лет назад
Shapefile or vectors to google earth in just one click in Qgis
Divide a polygon into equal parts or equal areas in Qgis 2.x
Просмотров 17 тыс.5 лет назад
Divide a polygon into equal parts or equal areas in Qgis 2.x
Import Excel Data to QGIS as polygon
Просмотров 3,2 тыс.5 лет назад
Import Excel Data to QGIS as polygon
Supervised Image Classification and Export to Drive #Google Earth Engine
Просмотров 4,8 тыс.5 лет назад
Supervised Image Classification and Export to Drive #Google Earth Engine
This crashed my qgis
Great video
Thanks
How's the minimum and maximum value taken?
Checkout my latest video
Keep going bro❤
Thank you brother for this video.❤
There is no processing plugin in my QGIS. Do you know why?
Open QGIS and press Ctrl+Alt+T
why you used min <= value < max ? ? ?
It reclassifies a raster band by assigning new class values based on the ranges specified in a fixed table. That is a comparison rules for the classification: the expression "min <= value < max" means that the value is greater than or equal to the minimum value (min) and strictly less than the maximum value (max). In other words, it falls within the range defined by min (inclusive) and max (exclusive).
Thanks for video sir..sir if I would like analyze one dtm relative to another dtm as reference...and the result is a classify dtm every 1 meter above and below the reference dtm...how to do that?
hi, how or where do i find the Vietnam data if my site is at vietnam?
You can find dem data of anywhere in GEE
Hi kapil, Can you teach me how to convert DEM data to terrain analysis data? I would like to know if GEE can be used in place of SAGA? Thanks again for sharing your expertise in this matter.
Sure
There are two methods to terrain analysis in GEE, 1st method: // A digital elevation model. // use NASA, USGS/SRTM, or ASTER dem product// var dem = ee.Image('NASA/NASADEM_HGT/001').select('elevation'); // Calculate slope. Units are degrees, range is [0,90). var slope = ee.Terrain.slope(dem); // Calculate aspect. Units are degrees where 0=N, 90=E, 180=S, 270=W. var aspect = ee.Terrain.aspect(dem); // Display slope and aspect layers on the map. Map.setCenter(-123.457, 47.815, 11); Map.addLayer(slope, {min: 0, max: 89.99}, 'Slope'); Map.addLayer(aspect, {min: 0, max: 359.99}, 'Aspect'); 2nd direct method: // Use the ee.Terrain.products function to calculate slope, aspect, and // hillshade simultaneously. The output bands are appended to the input image. // Hillshade is calculated based on illumination azimuth=270, elevation=45. var terrain = ee.Terrain.products(dem); print('ee.Terrain.products bands', terrain.bandNames()); Map.addLayer(terrain.select('hillshade'), {min: 0, max: 255}, 'Hillshade'); //obtain and display ‘slope’, ‘aspect’ same as Hillshade. To export the terrain data to google drive: // A digital elevation model. var dem = ee.Image('NASA/NASADEM_HGT/001').select('elevation'); var terrain = ee.Terrain.products(dem); // Define the region of interest as a geometry. // var roi = // Export the terrain data to Google Drive. Export.image.toDrive({ image: terrain, description: 'terrain_data', scale: 90, // Adjust the scale to your needs. region: roi, folder: 'your_export_folder', // Specify your export folder. maxPixels: 1e13 // You may need to adjust this value based on your image. });
@@KapildevAdhikari thank you very much 🙏🏻🙏🏻🙏🏻🙏🏻
hello, do you have soiltexture code i really need can you help me please
DM at kapildevadk@gmail.com
Very good !
Next version release मा Over Bark / Under Bark method, सिधै Excel file import system थप हुनेछ ।
Good job,,,
Nice chha bro. Good job.
Wauuu ❤❤❤
You always give us something plus
Software को लागि तपाईको email id यहाँ comments मा लेख्नुहोला ।
thx u sir
nimependa hii
NZURI SANA
Thank u brother, it uses me a lot
This is awesome really
The problem with Legend is solved, but after exporting I can see a black and white image. Please help me
After area calculation I got only 9 elements but there should be 10, what is the issue?
Do you notice that there are values starting from 0 and ending with 9 @console.
@@KapildevAdhikari It starts from 0 to 8, but after I changed the scale to 50 (randomly) I got all the 10 classes. Could you explain the reason?
@@babitamalakar829 it may depend on study area (geometry) size.
@@KapildevAdhikari ok. Can you help me to get the legend displayed? I am not able to do it
@@babitamalakar829 simply provide me your script.
Hi Kapil, could you please help with calculating a time series of LST (Land Surface Temperature ) for a period of 15 years ? in GEE
Ok
Please provide me with your email if you don’t mind. I have a few questions and i think you might be able to help me.
@@boi_ratie kapildevadk@gmail.com
Thank you, Sir! All the best to you and your family! Your work is super excellent!
why the map turns orange after it is polygonized
By system, you have to categorize from symbology
How can we calculate the change detection for two years images.
ruclips.net/video/KyjNhAvQS2s/видео.html
Thanks a lot
Waaaayyy to long.
Call me 9284432670
Hello Kapildev, Wonderful tutorial, I would like to create a Land Use Land Cover raster for my study region, using LANDSAT 8 imageries for the year 2020. This raster would be required for SDM. I need some help from you. Can you please help me to get your email Id, so I can contact you. Once gain thanks for such a elaborative tutorial. Regards.
Dai it's not working 😥😥😥
But the interface map is 2020. How does it coincide with your satellite image? What if there are any urban developments? Or is it possible to change the year of the Google Earth Satellite Map
Great! How can I import a Sentinel 2 mosaic in Tiff format?
Kapil Jee, Great!
Why is it so quiet?
Excellent video! I have a question: And if I want to paint every area with a different color? Without having to select each area individually. How can I do that?
Is there anything similar for custom parts? like this: I have an irregular polygon that I need to divide into 4 parts and I have the hectares that correspond to each part. Is it possible that the qgis throws the divisions to me in an automated way? .. Thank you
Yes, just try it.
I am also looking for similar functionality, have you figured out anything?
hello bro, i am facing SLC scan error in Landsat 7 image how to fix it.
This was dope, Thanks !
Pro tip : you can watch series at Flixzone. I've been using them for watching loads of movies these days.
@Pedro James Definitely, been using flixzone for months myself :D
@Pedro James Yup, I've been watching on Flixzone for years myself =)
@Pedro James Yup, I've been using Flixzone for since december myself :)
@Pedro James Yup, have been watching on Flixzone for months myself :)
I want to use the google earth engine to evaluate forest cover fluctuations for 1 area from 2013-2018, could you please help me !!!
Dinh Nhan Ngo Sure
@@KapildevAdhikari thank you, Can you leave an email for me to contact you?
do you have the code? shared me?
Wesley Carvalho see in the video description
How to import the same data for years in range 1980-2018
Does it work on QGIS 2.18? Thanks
Jean Randri yes, it’s for Qgis 2.18
Thanks
I don' understand. When shapfile has been created, it doesn't look like the reclassified raster... How can I get a shapefile with the exactly the same classes of raster? thank you a lot...
you will have to polygonise
It's a very nice explanation. Thank you brother. Would you please help me to find change percentage w.r.t each class and chart them.
can you find it? I need it too.
how to use "polygon divider" in 3.12 ?
Wait for few months to use this tool in qgis 3.x version
Divide / Split polygon into equal parts or equal area polygons in QGIS 3.x ruclips.net/video/M0dzHhjZJuQ/видео.html