
- Видео 143
- Просмотров 477 575
Learn data analytics with us
Великобритания
Добавлен 29 фев 2020
In this channel our main aim is to teach different data analytics tools (Like Excel, VBA, STATA, R, R shiny, Tableau, Power BI, Zoho, Google Analytics etc.) to our viewers and subscribers.
Why is a negative number multiplied by a negative number is positive? (-ive * -ive = +ive?)
In this video, I am discussing the multiplication of negative numbers. This video probably can be helpful for SAT GRE GMAT Calculus Basic Mathematics students.
Просмотров: 115
Видео


9. How to change the text orientation or angle to vertical in Online Microsoft office 365.
Просмотров 2,1 тыс.2 года назад
How to change the text orientation or angle to vertical in Microsoft office 365 with the help of a trick. The same solution is applicable to files saved in Google Drive or OneDrive.
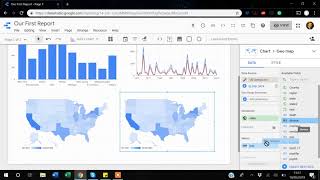
2. Geo maps and Layouts in Google Data Studio
Просмотров 14 тыс.2 года назад
2. Geo maps and Layouts in Google Data Studio

11. Learn Google Data Studio in 25 minutes
Просмотров 2022 года назад
11. Learn Google Data Studio in 25 minutes

10. Use Existing Reports for your own use in Google Data Studio
Просмотров 2232 года назад
10. Use Existing Reports for your own use in Google Data Studio

9. Date Format in Google Data Studio
Просмотров 8 тыс.2 года назад
9. Date Format in Google Data Studio

8. Blend or merge data sets in Google Data Studio
Просмотров 3,2 тыс.2 года назад
8. Blend or merge data sets in Google Data Studio
7. When if Condition in Google Data Studio
Просмотров 8 тыс.2 года назад
7. When if Condition in Google Data Studio
6. Add New variables in Google Data Studio
Просмотров 1,8 тыс.2 года назад
6. Add New variables in Google Data Studio
5. Data Connections in Google Data Studio
Просмотров 2782 года назад
5. Data Connections in Google Data Studio
4. Date Range Controls in Google Data Studio
Просмотров 8 тыс.2 года назад
4. Date Range Controls in Google Data Studio
3. Filters and Score Cards in Google Data Studio
Просмотров 2,2 тыс.2 года назад
3. Filters and Score Cards in Google Data Studio
1. Introduction to Google Data Studio
Просмотров 3492 года назад
1. Introduction to Google Data Studio
20. Sidebar Panel change as you move to different Main Panel Tab in R Shiny
Просмотров 2,3 тыс.3 года назад
20. Sidebar Panel change as you move to different Main Panel Tab in R Shiny
19. Nested Columns, Fluid Rows and Formatting in R Shiny
Просмотров 1,1 тыс.3 года назад
19. Nested Columns, Fluid Rows and Formatting in R Shiny
18. How to Publish your Shiny App. So that users can use it through web browsers
Просмотров 4053 года назад
18. How to Publish your Shiny App. So that users can use it through web browsers
17. How to change Formatting, Orientation, Alignment of your R Shiny Dashboard
Просмотров 5663 года назад
17. How to change Formatting, Orientation, Alignment of your R Shiny Dashboard
16. How to Insert Image or Video in your R Shiny Dashboard
Просмотров 8 тыс.3 года назад
16. How to Insert Image or Video in your R Shiny Dashboard
15.R Shiny Quick Overview about how to Setup a Dashboard
Просмотров 4,5 тыс.3 года назад
15.R Shiny Quick Overview about how to Setup a Dashboard
14. File Input (fileInput) option in R Shiny
Просмотров 4,5 тыс.3 года назад
14. File Input (fileInput) option in R Shiny
13. Action Button in R Shiny for controlled reactivity
Просмотров 3,9 тыс.3 года назад
13. Action Button in R Shiny for controlled reactivity
12. Dynamic UI (User Interface) in R Shiny
Просмотров 9573 года назад
12. Dynamic UI (User Interface) in R Shiny
9. How to add Download Button in R Shiny
Просмотров 2,2 тыс.3 года назад
9. How to add Download Button in R Shiny
Sorry but the amount of ads in this video is just ridiculous
Sorry I don't have any control over ads.
@@learndataanalyticswithus5437 sorry I didn’t know about that. I guess I was just frustrated, your video did help me though! I appreciate your content.
Thank you so much for your appreciation!!
The best explanation :D
Thank you so much for the appreciation!!
Have watched the first video it is really nice thanks brother
Thanks for the appreciation and feel free to share and subscribe!!!
This was really helpful for me! The following link contains a number of videos on STATA where I have solved real-life problems. This may also help you. www.youtube.com/@bangkimbiswas8598
Asante sana (thank you very much). I found this very helpful
You are welcome and thanks for appreciation!!
its like he takes 35 days to complete a sentence
I think you can increase the playback speed for the better experience. Thanks for your patience
Many thanks for the a great demo to explain this concept.
Glad it was helpful!
Hi! Almost found what I was looking for in this awesome video, thanks. Do you know if there’s a way to use a data range control as a calendar table? This is, that it uses two different date columns to filter? Both columns are in the same blended table. Thanks in advance.
Thanks for your message! Can you try to explain it in a bit in more detail please ?
@@learndataanalyticswithus5437 Absolutely. I´m using a blended table that has two date columns (each one from two diffent tables). In a table visual the filter range filters the first of them but I need it to filter also the second one. That happens even if I exclude the first date column and leave the table visual with only the second date column in it. I know that happens because there are records that are within a certain filter range in the second date column and out of that range in the first date column, and it doesn't show them. How could I fix that?
Thank you very much for detail explanation.
You are welcome. Feel free to share these videos. Thanks again
Sir, Thank you so much for your explanation. I need some help for my task. So, i have a task. The details are : Treatments: There are three different treatments about X leaf ( young leaves, medium-aged leaves, and old leaves). Repeats: Each treatment is repeated three times. Data: Each treatment has one column containing 255 compound data points (results from GC-MS analysis First column is compound data point (there arw 255 data), then the treatments are in column 2,3,4,5,6,7,8,9,10 . Then, i need to make cluster n find a marker for each treatment. Then, my teacher said that i need to use p value n t value to find the MAYOR COMPOUND. And I try to figure it out and learn it, but I can't found the solution. Do you have some suggestion for solve my task? What should I do to find the marker (possibily significant compound) marker or each treatment? Sorry for my poor english, i hope you can undestand it😢
Hi Thanks for your message, Unfortunately I didn't get your question. Kindly can you try to explain it again? Thanks
@@learndataanalyticswithus5437 what should I do if I want to find P value n t value for every variable for each treatment with R studio.?
I personally think you will need to create a loop that will help you to perform t test for each variable and then save the p value in another vector. Thanks
Hey, I want to contact you. How may I contact you related to the STATA course?
Thanks for your message sure you can reach me through the given below email address: learn.with.eagerness@gmail.com
Once you message kindly send me a gentle reminder here too 🙏 Thanks
@@learndataanalyticswithus5437 I sent an email to you. You can check.
Kindly send an email to the given below address learn.with.eagerness@gmail.com U have sent an email on wrong address
I think I got your voice message but kindly send an email to the above address I just shared. Thanks
Thank you for this very useful video on this topic. I have not been using STATA since 2018 and thus almost forgot everything. This is a good refresher for me.
Thank you so much for watching the video. There are several other videos that I made related to Stata that you may like ruclips.net/p/PLEJsR-Ek_ZPJEb-nXq1_s7m_hes75uD4D&si=RZkjoNN-eqCQ4ZBa
@@learndataanalyticswithus5437 actually I have been watching the whole playlist for sometime now. Thank you once again.
Thank you so much for watching the videos!!
Thank you so much 👏🏻👏🏻 this video saved mee !!
Thanks for your appreciation! Feel free to share and subscribe to my channel. Thanks again!!
thank you so much
You are welcome! Thanks
Hi, I am facing troubles with the tab type command. STATA is showing "variable type not found" (r111). I think it'll work if you let us know the variables in your updated file. Maybe, my auto2_updated file does not consist of all the variables that you have in your dta. Thanks in advance.
good videos but the indian accent drvies a non English speaker really crazy……
very simple yet effective, learning a lot thanks sir.
Thank you so much for your support and appreciation! Thanks again
Hi, Thank you for the Tutorial! I tried but the video timeline control button does not work when its your local .mp4 file. For example, if I want to jump the video for half of it, after pressing play, it does not work. Do you know how can i fix that? Thank you in Advance.
Thank you so much for your message. I will look into this issue and let you know if I am able to find the solution. Thanks again
This is indeed very useful. I just downloaded STATA today, and this is my first connection with the software that I need for my masters thesis. I feel like this video series will give me the tools to succeed.
Thank you so much for your support and appreciation. Thanks again!
You need to increase the volume on your voice recording. Other than that I am sure your presentation and tutorial skills are brilliant. I just wish I could hear it.
Thanks Mark! I will try to find a way to improve the volume in my videos. Again thanks for your appreciation.
Is it possible to add images or videos into a shiny dashboard without the www folder? E.g. a youtube video.
Do you want to upload video directly from your own drive?
@@learndataanalyticswithus5437 I don't think so. I mean like the url of a YT video be added to the dashboard.
No I don't think so u need a URL for this. Thanks
Thanks for the reply. Do you have videos or references regarding the case?
I will think about it and let you know in case if I am able to find anything useful for you. Thanks again
See in first case data set 2 have houshold id 5 have data but it's not coming in the blended data set . Point 2 I have query i have two data set i have income and another one have experience i need to get that one single pivot table in Google dashboard but note I have only the branch name is the same in two data set but it's not a unique it's have like one branch have income and for same branch expenses don't have so need to show only income how do I achieve this please advise
Thanks for your message. If you go the video at 9:45 you will be able to see the link icon between two data set you can click it and change it to any of the below options. Joins configuration get a dedicated popin, accessible between each table clicking through a recap box summarizing the join type and the number of join keys This panel contains the join keys and join types Left outer join Right outer join (new) Inner join (new) Full outer join (new) Cross join (more explicit than before) Hopefully this will solve your problem. Thanks
Nice,it is highly helpful!
Thank you so much for your kind words ☺️!!
I am waiting for more informative videos about Stata. thanks
Sure! I am planning to make a few more videos in the coming days. Thanks again for your support.
Tnx
Thanks for the appreciation thanks again 😊
thanks alot
Thank you so much for the appreciation and feel free to share these videos with others. Thanks again!
why in my page, i cant chose the zoom area. Please help me if you know how to fix it
There must be a zoom option in your dashboard. I think saving and reopening your dashboard may fix this problem
thank you so much!! this is so helpful!
Thank you so much for your support! Feel free to share it with your friends. Thanks
hello Just create a backup try to replicate application in another account backup for forms are create separate files for every lookup field
Feel free to reach me in case of any questions. Thanks
Thanks Mr Khan 🎉❤
You are welcome!!!
i do not want to combine the tables. only load multiple tables within a file. how can i do that
If you are just looking to load follow these steps: 1. Select “Get data” from the top toolbar. 2. Under the options, select “Folder” and click “Connect”. 3. Your files will show up and give you three options. Load Data, Transform Data Combine Data - this option is new for this type of file upload. Click Load Data
Thank you again for your videos. And again, a question, it it`s all right: if I don`t want to drop the duplicates entirely, but I want to save the other info in a string, is that possible? For example: 1 - a, 1 - b, 2 - c "dataset", is it possible to make it 1 - a b, 2 - c? If yes, how?
I think you need to look for reshape data set first Search reshape in Stata and you will be able to do the thing you mentioned above
Thank you!
Thank you very much for your videos. They are extremely helpful as a Stata beginner. I would like to ask a question regarding appending many files. If the file names are the same, except the ending, for example apple1 to apple10, is there a possibility to write a foreach i of numlist 1(1)11, and incorporate i into the file name?
Thanks for your support and feel free to share it with others!! Related to your question, first you need to import the files into Stata and save it as tempfile and then call these tempfiles in a loop something like apple'i'
Thank you!
You are welcome!
how to clean data in the simplest possible way?
It's a million dollar question:) The easiest and common way of data cleaning is by using functions like strmatch, substring and subinstring
how to download this file]
You can download the data file through the link below. www.dropbox.com/s/f5wwcwhu88h3apu/auto.xlsx?dl=0
thank you very much for creating this series! My uni teaches me stata but expects us to know everything about it beforehand. Thank you very much Sir, for creating this helpful guide!! ✨✨✨✨
Thanks for your kind words! Feel free to share with your friends!! Thanks again
It is too helpful. Thanks
Thanks for the appreciation!
Useful video even the beginner, Thank you!
Thanks for the appreciation!!
thank you so much
You are welcome! Feel free to share and subscribe. Thanks again for your support 🙏
Thank you
You are welcome!
Thank you
Thanks for your kind words 🙏!
Thanks
Thanks for your appreciation 😊!
Makes sense! Thanks
Thanks for your appreciation!
thank you so much for this playlist, indeed very helpful!
Thanks for your appreciation and feel free to share with others. thanks again
Thank you for making this playlist! Very helpful.
Thank you for your support!
I could listen to your voice 🙁
Strange 🙀
I just checked the audio is working fine
can you provide STATA link to download
Sorry I don't have any link from where you can download it for free. Probably I think you can request a trial version from the Stata website. Thanks
HOW TO ADD FILTER TO ANY SCORECARD?
The filters will automatically control your score cards too. Thanks
Thank you for the video. I am trying to run cross validation with kfold. However, I want to use the first 13 observations to train the poisson model and then validate it with the last 5 observations. and then make the predictions. However my do file is giving me errors. This is my dofile: local num_folds = 3 forval fold = 1/'num_folds' { if `fold' 1 qui keep in 1/13 else if `fold' 2 qui keep in 1/13 else if `fold' 3 qui keep in 14/18 poisson NumberofAccidents Entrywidthe Entryangle Exitwidthex ExitRadius Cyclelanewidth InscribedDiameterD InAADTMajV lnAADTMajP lnAADTMinV lnAADTMinP, exposure(exposure) predict estimatedaccidents if `fold' 3 list estimatedaccidents if e(sample), noobs}
As I don't have the data so I can't test your do file. However, the thing that can be a possible cause of error is that you are trying to run mode on very few observations.
Is there a way to use the input control so that you can enter a number and then use that number written in the input control in a calculation with another field? Basically I am trying to create a field which I can use in my calculation. Like a calculator.
its possible but advance knowledge of Google Data Studio will be required. Thanks