

- Видео 6
- Просмотров 151 911
Finance Explained
Добавлен 4 май 2011
A channel dedicated to educating people about finance and demystifying finance math.
Option Delta Explained - Derivation Walkthrough
A short video breaking down the derivation behind Option Delta, and why N(d1) is technically not the whole picture.
Black Scholes Full Video: ruclips.net/video/EEM2YBzH-2U/видео.html
Black Scholes Full Video: ruclips.net/video/EEM2YBzH-2U/видео.html
Просмотров: 755
Видео
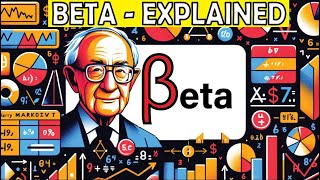

Beta for Finance and Portfolio Management Explained
Просмотров 2,1 тыс.Год назад
In this video we detail the concept of beta, different methods of calculation, as well as examining some of the shortcomings of this financial concept. Beta Worksheet can be found here: docs.google.com/spreadsheets/d/1Fis7U-7MYi6DIM CWwS3NmCkBvL010R/edit?usp=sharing&ouid=109762342446452973013&rtpof=true&sd=true NOTE: Remember to download the file into Excel in order to see the whole document an...

Black Scholes Explained - A Mathematical Breakdown
Просмотров 36 тыс.Год назад
This video breaks down the mathematics behind the Black Scholes options pricing formula. The Pricing of Options and Corporate Liabilities: www.cs.princeton.edu/courses/archive/fall09/cos323/papers/black_scholes73.pdf Excel Model docs.google.com/spreadsheets/d/13r0C-ruwBv8orA_yEbEiyFDlgrYjRmrS/edit?usp=sharing&ouid=109762342446452973013&rtpof=true&sd=true 3b1b Normal Distribution Video ruclips.n...

Supply and Demand - Explained
Просмотров 5932 года назад
This video covers the basics of Supply and Demand, and shows what happens when there are shifts in demand and supply, why these changes might occur, and how prices and quantities are impacted.

Markowitz Model and Modern Portfolio Theory - Explained
Просмотров 112 тыс.2 года назад
This video covers the basics and mathematics of Modern Portfolio Theory as well as a brief overview of the CAPM methodology. Be sure to check out the Excel file below, which helps to run through the math and provides an insight into portfolio construction using MPT. The Excel Sheet can be found here: docs.google.com/spreadsheets/d/18TErLjolES54Um0WMi_k-N6_QSi5-U7T/edit?usp=sharing&ouid=10976234...
What if the returns themselves are volatile? Say in a project allocation scenario where the returns are volatile? or Investment in a stock? Beta is more like a correction factor... But what if, I want to use something like "I expect 10% with a probablity of 70% and 15% with probability of 30%"... How do I optimize for this scenario?
@@musicalwanderings7380 good question. You are hitting upon the idea that you have multiple outcomes. This is where a Monte Carlo simulation may be helpful to understand the relationship of multiple return scenarios across assets. Another and more simple option could be to take the expected value of the assets. If you expect .1*.7 and .15*.3 take them and sum together to arrive at 11.5% (if I did the math right, won’t stand by my quick phone calculation). This gives you an expected value for the return of the asset. Edit for grammar
@financeexplainedgraphics Thank you! I am working in the field of Capex allocation to projects. So the outcome from a predictive model is probabulistic and hence the question. A question on monte Carlo -> I can't assume all projects are totally independent while running the simulation. How can I incorporate the covariance into the simulation? Great video! Keep up the great work!!!
@ the covariance relationship captures the relationships of their covariances (their quasi independence)
@@financeexplainedgraphics My question is: When I run Monte Carlo simulations, how can I account for the fact that projects may be interdependent...i.e. the probability of one going less...can be related to the probability of another going down together... Am I making sense?
@ I understand what you are saying - which is why the weighted average of the outcomes is likely a better and cleaner solution. By doing the weighted average you now capture a single point to assess against the covariances of all the other assets in the covariance matrix. No need to worry about how the returns covariate because those are already captured. Again, you are trying to answer: Which portfolio is best. It isn't answering: which portfolio is best given a range of outcomes... in that case the answer is a range of portfolios, but we can only select one given the constraints of our universe. Again, we want to try and find the optimal solution given the average expected outcomes. It doesn't really help if you construct a bunch of potential outcomes and present to management and say , "See, we could allocation amongst these 100 combinations." So what? What you need to do is say, "Given our weighted probability of expected outcomes, this portfolio is likely the most optimal based on how these assets interact with each other historically." THIS MODEL IS NOT A SILVER BULLET. It will never be perfect. Covariance structures change over time, return expectations shift to new information in the market, all you can do is model it using the most up to date information you have and use this as a basis for your ex-post argument. People will ask "Why did you buy XYZ and not more of ABC?" And you will say, "Here was the math and analysis of the assets performed at the time, and this is why we made the decision."
Cok guzel Abi cim Adam benim
I have question the (Expiration (in years) (T)) is my option contract is 30 day or less than that How can it be written ?
@@saaryah7055as a fraction. 30/365 However! You bring up another good point. 30 days or LESS. If you can exercise your option at any point in the next 30 days you have an American style option. The Black Scholes makes another (unfortunate) assumption that we are valuing European style options (these have nothing to do with where they are traded and are just names). European style options can only be exercised at expiration. Therefore, there is some discrepancy and debate as to how you appropriately value American style options. Black Scholes works as a great basis for American style analysis, but with that understanding there is still more work to be done on refining the model further to reflect the American style exercise dynamics.
@@financeexplainedgraphics So it's inaccurate because I want to apply it to contracts that are less than 30 days
@ No. If it’s 7 days T=7/365 It’s inaccurate (close but not perfect) if the contracts can be exercised in X days or less. Versus it can only be exercised in X days.
Amazing video. Please add a "Thanks" button.
THANKS!
Back ground music name please ??
you're the man!
🏅 🏅 🏅... sometimes, to truly appreciate the telling of " Time " , one should be exposed to the intricate genius of how the "Clock" was built 🏆 🏆 🏆
Awesome explanation. Thanks a ton.
Loved it!!
Why use volatility as a measure of risk? Say you have a volatile stock for a company with strong moat and financials, but which is currently trading at low multiples on earnings. Would purchasing this stock at this time be considered risky, even though it's a high quality business at a cheap price?
@@absw6129 One is an opinion: strong moat - maybe. Low multiple, why if strong? Financials are “strong”, but maybe under employed 🤷♂️ Whereas volatility (relative to others, covariance) is an objective and observable feature unique to that specific stock. You could find a volatile stock that does have a great business underlying it and it might be of good value, but the stock is high vol. But in terms of portfolio management, it is risky because it represents an asset that could gain or lose you money more easily than something else. Therefore, placing it in your portfolio will objectively make the portfolio more at risk of losing more money. It doesn’t mean you shouldn’t own it, but you should consider balancing it with less “risky” positions within a broader portfolio to suit your personal risk appetite.
@financeexplainedgraphics i guess perhaps it depends on how we define "risk"? I view risk as "likelyhood of permanent loss of capital", which requires more qualitative factors to be taken into account, whereas the volatlity model seems to view risk as "likelyhood that at any given time, the stock price will change by X%". Am I somewhat correct? Let's apply it to the 2008 financial crisis. Due to the recent drop in price, a lot of assets were more voltile than normal. But I would argue that the lower prices at the time, had actually de-risked the assets.
@@absw6129 To an extent. But I think you are looking at the individual investment. This is fair when looking at one investment. But how do you put multiple assets’ risks in relation to one another and how those multiple assets interact when put together? The point of Markowitz Optimization is to encourage us to think about how assets can relate to one another in a portfolio. I think your approach is completely valid on a deal by deal basis. This is how, in my opinion, we should assess the R component. Or the side of the equation we want to maximize. Is this a good company? What can I expect the returns to be? And if the company is undervalued, then this makes R way bigger and despite higher vol, the model will recommend you hold a larger portion of the total portfolio in this asset. When you say a company has a low PE or a metric you believe is indicating value, this is more of the return side of the optimization. You are saying “wow, this asset is cheap! The return potential is huge.” This likewise impacts the optimization model massively. In the video we use CAPM - it’s just one method and one with which I have many grievances.
A book to help understand this is frequently ask questions about quant finance
min 5:21 and on: the normal distribution formula should have e^(-x^2/2) and not e^(-x/2) . Please correct it.
@@the_curmudgeon1975-bp4hc Sure. I’ll re-upload the video.
SIGMA
i do not understand this, i am a high schoool student
Why do you even take the first order derivative of the options price?
i thought id be able to understand it as someone who knows nothing about finance imto help my investing. i was wrong😅😂
@@ghadaezzeddine7475 for those newer to finance, I think the concept of Risk versus Reward is the most important part to grasp. This helps you understand the Efficient Frontier Curve concept. You need to find the balance of a portfolio where the risk is inline with your comfort level. As for the math, feel free to download the attached excel file. You can enter some of your own assets returns from Yahoo finance (or whatever you get your financial data) and see how different amounts of each impact your portfolio.
Ln is the natural logarithm an ln(1)=0. You mix things a little first saying it is the « lognormal » function. Lognormal is typically a kind of distribution where if X is normal then ln(X) is lognormal. Moreover you make a common confusion between ln et log. Log(x)=ln(x/10), thus log(10)=1
What study of math is used for this?
@@Aces314 it’s mostly linear algebra. For risk management, I’d say it’s one of the more applicable areas of math.
what happened to e^1 at 4:12? are we not assuming t=1, so it would be K(e^1)N(d2)?
Great question. It is e^(-rt) where t=1 and r =0, (interest rate free world). This makes it so that e^(-0*1) = e^0. Anything powered to 0 is equal to 1. So e^0 = 1, and when we see a variable equal to 1, we can ignore it in our simplification.
which tools are used for making such a good video?
@@kuajingwuyou 😂 glad you liked it. I use Adobe Illustrator to make the puppets and backgrounds and Adobe After Effects to make them move and edit the video. Hope that helps!
Thanks, this was excellent coverage of Black-Scholes as-is👌 However, put-call parity is BS. This is largely because volatility doesn't have 50/50 correlation with upward/downward price movements (or in other words, it's not entitely independent of price movements). There is often an imbalance in put-option pricing which depends upon the market environment and the expectations of market participants.
@@david0aloha 100%. In the “real world” put call parity doesn’t always shine through the way our model’s theory would suggest. All models are wrong but some models are useful. Black Scholes is often wrong, but still useful. For me, the strength of Black Scholes is in its simplicity, and how well it generalises a complex relationship in so few variables and so little actual math.
Magnificinet explanation, it was super clear!
Love your videos 💯
Can there be a situation of surplus quantity being sold at higher price ?
Great question! Given our supply demand graph shown in the video - no. Why? Because the supply demand graph in the video makes a few assumptions, such as: perfect availability of the product, perfectly functioning markets, and all agents involved know how much or how little of something there is. In reality, something like what you have mentioned can happen, but its normally because what you have observed is occurring in two (or multiple) distinct markets. Here is an example. In town A, many bananas are grown and there are many banana stands. One day the government puts a tax on bananas, resulting in a higher price per banana, decreasing quantity demanded. But the supply is already fixed, as the amount supplied has all ready been grown. Now we have a surplus of unsold bananas due to the new tax. So, one industrial thinking banana stand entrepreneur goes to town B, that has no bananas, and sells his excess bananas for even more because the supply is so low and demand in town B is strong. Is this a violation of supply and demand? Not really, because town A and B actually represent two different markets. Perhaps there is a geographic or political barrier preventing them from engaging in perfect trade of bananas, but the fact remains, that town B is isolated and therefore its economic model should be considered separate of town A. All this to say, we can observe various prices for things in different parts of the world, not because supply/demand is broken, but because we are observing different markets for the same product due to geopolitical or social differences that cause barriers to trade.
@@financeexplainedgraphics ok thank you very much , one more question , is the given graph restricted due to the base price of the supply , if it altered to the supplier's wish , then how will the graph react ?
@@vanditstech9081 I might not be understanding your question, but what I think you are imagining is a monopoly, which can dive into a very different analysis. Our model assumes that markets are efficient and costs to purchase are equal everywhere. Another key assumption is that there are many suppliers (competitive market). By asking if the supply can alter with the supplier's wish, then what you are assuming is that a single supplier controls the market's curve - i.e. a monopoly market. In this case, the monopoly creates the curve based on its particular supply curve structure. If the monopoly has a shift in it's supply curve there would be a massive shift in the market, but prices would still ultimately find an equilibrium, however, if the monopoly finds that their bottom line is hurt at that equilibrium, it could charge an inefficient price to maximize profit. The monopoly's actions would be dependent on the shape of the demand curve and its supply cost structure. The only way that equilibrium is not met in competitive markets is if there is a sudden shock to the system exogenously (from the outside). In my last example you had a banana tax, which shocked the system. This resulted in a surplus of unsold bananas. The inverse of this would be if you had had a government sponsored subsidy, then you would have had a shortage of bananas (more people would want to buy the bananas because the government had helped lower the price), but you wouldn't have enough bananas supplied leading to the shortage. After the system is shocked, and the equilibrium is disrupted, the supply curve would then be expected to shift to accommodate this change. All the suppliers in a competitive market would work to meet the lower supply (thought they would do this each on their own and the aggregate change would produce the new supply curve), or in the case of a monopoly the one supplier would alter its production to accommodate (assuming the accommodation aligns with its interests). In the banana tax instance (assuming Village B wasn't there to pick up the extra bananas), the suppliers would produce less bananas next season to meet the new level of lower demand (less demand because the taxes increased the price consumers had to pay). But once again, the equilibrium would be met and the right amount of bananas would be supplied. There really aren't any "restrictions" to the graph. The concept is that there exists, for any product, an equilibrium price that everyone will gravitate towards. That equilibrium is constantly shifting in the real world due to changes in taste (demand) and input prices etc. (supply). However, these shifts in the curves adapt quickly as consumers and producers work to find the new equilibrium. Adam Smith called this concept the "Invisible Hand", because it was a mystery to him as to how all these players (who don't know one another) always find the balance. Today, we call the concept "free markets" where sellers and buyers transact freely to negotiate the right price. When you think of these curves, don't think of one transaction, rather think about the whole economic system for a single good or service. The graph is showing the aggregate for that system. If you look at un-free markets ("command economies" like communist economic systems, where all supply of goods is controlled by the government or central planning authority) you will see massive shortages and surpluses of goods. In the Soviet Union, for example, it wasn't uncommon to have way too much of something or way too little of another thing. This was because what was supplied was based on the government's mandate and not based on businesses working with consumers to find an equilibrium. Moreover, when you have price fixing, where the price someone must pay or must sell at is fixed by law, then the equilibrium cannot adjust to meet the new level of demand or supply, thus causing shortages and surpluses. This is the major economic argument against command economies. Was this helpful in answering your question?
I have been trading for over two decades and have never come across a more articulated and Troy explanation for Option prices.
I have been trading for over two decades and have never seen somebody able to articulate Option prices and Delta so well.
I have been trading for over two decades and have never seen somebody able to articulate Option prices and Delta so well.
I have been trading for over two decades and have never seen somebody able to articulate Option prices and Delta so well.
I have been trading for over two decades and have never seen somebody able to articulate Option prices and Delta so well.
I have been trading for over two decades and have never seen somebody able to articulate Option prices and Delta so well.
I have been trading for over two decades and have never seen somebody able to articulate Option prices and Delta so well.
Thanks for the video! Now I understand how to get delta.
Great video
LOVE THE CONTENT KING
No YOU have a great day
I think your definition of the cumulative normal distribution from 5:26 on is missing a square. It should read N(d_i) = \frac{1}{\sqrt{2 \pi}} \int_{-inf}^{d_i} e^{-x^2/2} dx
Oh no! I think you are right. I went back into the production file and the ^2 was there but I had hid the layer 😢. Thank you for catching it. Yes, it should be {-x^2/2}
notational pedantry: ln is usually used to represent the natural logarithm not the log normal
You are right! Good catch …. I’ll be having a word with my script writer later 😉 Thank you for clarifying!
THE best!
OOOH my goodness, everything clicks now!
That a beautiful explanation. I was able to reconstruct all the parts and to test it and it works beautifully. However one part didn't work. On 8:20 you are saying that if time to expiration is very short delta is either 1 for itm or 0 for otm. I changed T to 0.0001 and moved the strike above and below the spot and the sheet returned a 0 for both d1 and ď2 and 0.5 for nd1 and nd2. I was hoping to see 1 and 0. Maybe google sheet can't handle these small values.
Sorry. I had a mistake with the denominator. Fixed it. Perfect
Great! I was going to reply to this earlier but needed access to my computer to check, however you beat me to it. Glad it is working for you now!
great videos keep uploading sir
3:34 what’s your justification for reducing d2 to d1?
d2 is not reduced to d1, there is still a negative sign in d2 that is not in d1. However, the reason I reduce it down from the original long form of d2 = (d1 - sig(T)) is because it is a little easier to see visually, and it highlights that the difference between d1 and d2 are their inverse relationships with regard to volatility (sigma). I show the long form initially because when you see Black-Scholes, much of the time d2 is shown in the long form.
@@financeexplainedgraphics I see thanks
I think the Normal Distribution Function as explained here (5:21) is wrong. It should have e^(-(x^2)/2) instead of e^(-x/2). Source: www.google.com/search?q=normal+distribution+function&oq=normal+distribution+function&gs_lcrp=EgZjaHJvbWUqDggAEEUYJxg7GIAEGIoFMg4IABBFGCcYOxiABBiKBTIMCAEQABgUGIcCGIAEMgcIAhAAGIAEMgcIAxAAGIAEMgcIBBAAGIAEMgcIBRAAGIAEMgcIBhAAGIAEMgcIBxAAGIAEMgcICBAAGIAEMgcICRAAGIAE0gEIMjE3M2owajSoAgiwAgE&sourceid=chrome&ie=UTF-8 The 3Blue2Brown video also shows that.
This channel is a hidden gem. Incredibly insightful, explained clearly and perfectly presented!
That’s incredibly kind! Stay tuned for more upcoming videos
Is there a calculator to us for this matrix?
You can calculate in Excel or any software you prefer. The linked Excel doc shows how this is done. Standard calculators do not perform these operations, and doing it by hand is very impractical.
The content is really well presented and very useful. One comment: would you have the courage to drop the “warnings” about math in the discussions? How can it be conceivably acceptable for anyone dealing or wanting to deal with finance not to be willing to deal with the corresponding math???
It's not a matter of courage, it is a matter of ensuring the "right" audience is viewing the video. I can see in the metrics a major drop after the warning is given - this is good, as it prevents viewers who don't want to watch the video seeing it and then giving it a "dislike", which harms my content. As for not wanting to deal with the math - you'd probably be surprised by the number of financial professionals who find mathematics "boring" and "tedious".
Ask your finance doc if MPT is right for you!
Pretty excelent explanation of Markowitz. The xls applies for fixed income too?
It does! Any asset can be modelled this way and added to the model
More videos please
On the way!
excellent! thank you very much