
- Видео 5
- Просмотров 295 631
Nees Jan van Eck
Нидерланды
Добавлен 25 янв 2012
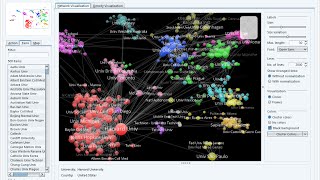
New features in VOSviewer version 1.6.17
In this video I demonstrate two new features introduced in VOSviewer version 1.6.17:
- Creating visualizations based on data exported from the Lens (www.lens.org).
- Online sharing of interactive visualizations using the VOSviewer Online tool that was released last week. See the following video for more information about VOSviewer Online: ruclips.net/video/DkIYxomqm4k/видео.html.
- Creating visualizations based on data exported from the Lens (www.lens.org).
- Online sharing of interactive visualizations using the VOSviewer Online tool that was released last week. See the following video for more information about VOSviewer Online: ruclips.net/video/DkIYxomqm4k/видео.html.
Просмотров: 6 373
Видео


VOSviewer Online
Просмотров 17 тыс.3 года назад
This video introduces VOSviewer Online. VOSviewer Online is a tool for network visualization. It is a web-based version of VOSviewer, a popular tool for constructing and visualizing bibliometric networks. VOSviewer Online is available at app.vosviewer.com/. More information can be found in the documentation available at app.vosviewer.com/docs/.

CWTS Leiden Ranking 2016
Просмотров 6988 лет назад
The CWTS Leiden Ranking 2016 offers key insights into the scientific performance over 800 major universities worldwide. A sophisticated set of bibliometric indicators provide statistics on the scientific impact of universities and on universities’ involvement in scientific collaboration. The motto of the 2016 edition of the Leiden Ranking is: Moving beyond just ranking.

CWTS Leiden Ranking 2015
Просмотров 9149 лет назад
The CWTS Leiden Ranking 2015 offers key insights into the scientific performance of 750 major universities worldwide. A sophisticated set of bibliometric indicators provides statistics on the scientific impact of universities and on universities' involvement in scientific collaboration. The ranking is based on over 25 years of bibliometric experience at the Centre for Science and Technology Stu...
Introduction to VOSviewer
Просмотров 271 тыс.9 лет назад
Dr. Nees Jan van Eck gives an introduction to VOSviewer. VOSviewer is a software tool for constructing and visualizing bibliometric networks. These networks may for instance include journals, researchers, or individual publications, and they can be constructed based on co-citation, bibliographic coupling, or co-authorship relations. VOSviewer also offers text mining functionality that can be us...
How do i develop a network with a ris file on vosviewer online?
ruclips.net/video/tD4hXCHOw0M/видео.html The videos in this playlist also may help you!
xclnt! thx
Thank you.
bedankt! superb cool apps for researchers.
hello sir.......thanku for such an informative lecture.......I have one request.....can u pls help me with the analysis of clusters in the co-occurrence of keywords .......I tried so much for this but can't find any solution........
This is amazingly insightful! Thank you so much for taking your time to contribute on how to use this exciting tool!. A question from my side is - in the case of interdisciplinary research where the literature is randomly distributed and won't all be in 'Web of Science', how do I make use of Vos then? Like is there a manual way to input the different papers I have selected as my research sample then since your video assumes that all the papers one would have used are also appearing in web of science. Hope this make sense..
In addition to Web of Science, VOSviewer supports a number of other data sources, including OpenAlex. Compared to Web of Science, OpenAlex has the benefit that its data is fully open and that it offers a broader coverage of the scholarly literature.
Can you also use Vos viewer for keyword-context analysis for .txt files without abstract? Not scientifical articles just reports/texts that you upload yourself?
VOSviewer is intended to be used for visualizing data on scientific publications. However, if you are interested in creating so-called term co-occurrence maps, then the software can also be used for other types of textual data. The data can be provided as input to VOSviewer in a so-called corpus file. (See the VOSviewer manual for more information on corpus files.) Please be aware that the textual data must be in English.
@@neesjanvaneck Thank you!:)
Does anyone know how to format cvs file so it will be accepted by VosViewer? It is not taking my csv file and my Excel does not offer csv.MS-DOS. Thank you!
Hi Ness Jan van Eck. I'm a student of doctoral program. I've downloaded the latest version of VOSviewer (2023) and Java 8. But, the co-occurrence button is not functioning. It can not be pressed. Would you like to tell me why? Thank you.
Please make sure that the keywords field is selected in the export settings of your data source.
Excuse me, I have a problem in the total link strength column, I get 0, what could be the reason for that?
Hello Sir. I tried to install and run VOSviewer after installing Java. However, VOSviewer is not running post several attempts. It always says that Java Virtual Machine could not be created. Could you please provide any solution so that I can follow and try again? Thanks in advance.
Is Web of science no longer working?
Thanks. It would be great if you could add the possibility t display labels in the capital, especially for countries.
Thanks for the suggestion. VOSviewer indeed converts input data to lower case. The reason is that some commonly used databases do not use upper and lower case in a proper and consistent way. By converting input data to lower case, we get rid of inconsistencies in the use of upper and lower case. However, this indeed means that names of authors and countries are not presented in a correct way, since the first character is in lower case, not in upper case. If you don't like this, you can fix it by saving your map in a VOSviewer map file, by opening this file in a spreadsheet program such as MS Excel, and by manually correcting the names of authors or countries in the 'label' column in the map file. When you then reopen your map in VOSviewer, the names will be presented correctly.
I am getting anonymous as author with maximum citations,how to get the author name in citespace?
Simple and easy to understand. Wonderfull
ruclips.net/video/1TNvhxbob_k/видео.html&feature=shares
How to search for a particular topic, say COVID
Hello, thank you very much for this video. How can we merge wos and scopus data for vosviewer. Can we use different files.
There are significant differences between the file formats used by different data sources. VOSviewer is therefore unable to merge files from different data sources. Unfortunately, for the same reason, manually merging the files is also not possible.
@@neesjanvaneck, thank you so much.
Thank you Professor for the information. Do you have a plan to released more information related the VOSviewer version 1.6.18? It will be very helpfull.
Dear Nees Jan van Eck, I have a request. Have any specific methodology to set the minimum number of occurrences? I also would like to know what you think about choosing or not the main keywords on the visualization map. Could we say that if you have a small number of keywords, then the main keywords could shade other circles on the map? In my analysis, I have 700 keywords and want to keep the main keyword to see the relationship and which cluster it belongs to and how linked with other keywords. Thanks in advance and Happy New Year!
Neat! Love to have a web version! Is there anything we miss out on if we only use the online version of VOSviewer? I'm gonna need to use it for university and was curious if the online version could do everything the standalone version can. Congrats on all involved in making and testing this!
Unlike the stand-alone VOSviewer software, VOSviewer Online currently does not provide any built-in functionality for constructing bibliometric networks based on data from bibliographic data sources such as Web of Science, Scopus, Dimensions, OpenAlex, Crossref, and others. The stand-alone software still needs to be used for this. VOSviewer Online can instead be used to make interactive visualizations of bibliometric networks available online and to easily share these visualizations. See for more information this blog post: www.leidenmadtrics.nl/articles/vosviewer-goes-online-part-1
@@neesjanvaneck Thanks for the response! Will definitely read the blog post.
Huge respects for you
Wish the video was longer and explains contents in details
How can we search a topic in vos viewer?
Thank you for your useful and interactive research tracking system analysis tool :) And I have some questions. Firstly, I think currently some modules applied the multi dimensional network for the corps. Do you have any plans to develop your tools into that concept? Secondly, would you let me know more specific oprational process and algorithms applied. If there are any recommendations for references, what would you recommned as use cases of your VOSviewer? Or do you have any sites you want to recommend?
Thank you very much for the wonderful guidance. Much appreciated. Keep well.
I can not find the site on minute 5.2. Please tell me please the link
www.webofscience.com
Hi Nees, can the software get corrupted? The latest version I downloaded is constantly showing errors and many of its functions are also not working.
I have not heard of other users having this problem. Perhaps you could send me a DM.
Thank you Nees Jan van Eck. You have not only created a useful algorithm, but also a very user friendly one😊👍
You have made an immense contribution to the field of research.. at par with Robert Gentleman/Ross Ihaka and Guido van Rossum. Keep it up 👍
VOSviewer is an outstanding tool for the academic community. Benefits from it are well felt by everyone watching this video.
Hi Nees, could you explain what are the differences among co-authorship, co-occurrence, bibliographic coupling, and co-citation in "type of analysis", if I all select "unit of analysis" as "authors"? Thank you!🥺🙏🙏
Apr-2023: In the manual for VOSViewer v1.6.19 (Topic: 2. Terminology, Page 6/54), I see ".. The strength of a link may for example indicate the number of cited references two publications have in common (in the case of bibliographic coupling links), the number of publications two researchers have co-authored (in the case of co-authorship links), or the number of publications in which two terms occur together (in the case of co-occurrence links)...". From this I infer that "co-occurrence" refers to "terms" (keywords).
CAN SOMEONE EXPLAIN THIS TO ME?
Is there any option on Windows/MacOS version to change the small letters in to capital i.e. nees jan to Nees Jan, or plos one to Plos One, thank you in advance
The Windows/MacOS version of VOSviewer indeed converts input data to lower case. The reason is that some commonly used databases do not use upper and lower case in a proper and consistent way. By converting input data to lower case, we get rid of inconsistencies in the use of upper and lower case. However, this indeed means that names of authors and countries are not presented in a correct way, since the first character is in lower case, not in upper case. If you don’t like this, you can fix it by saving your map in a VOSviewer map file, by opening this file in a spreadsheet program such as MS Excel, and by manually correcting the names of authors or countries in the ‘label’ column in the map file. When you then reopen your map in VOSviewer, the names will be presented correctly.
@@neesjanvaneck Noted with thanks!
Lovely to see the online version of VOSviewer, many many congratulations to you and your team members!
Thank you for everything you have done for the scientific community!
Hello, thanks for the video. I would have 1 question. Are there any techniques to make some items more visible in Vosviewer? Is manipulation or change over plain text possible?
Yes, this is possible: 1. save the VOSviewer map (or JSON) file, 2. open the file in a text editor, 3. change the weight of an item and save the file, 4. re-open the file in VOSviewer.
@@neesjanvaneck I succeeded! Thank you so much for your directions :)
Thank You
Really nice, thanks a lot!
Thank You
God loves you who's reading this comment and that's why He sent His begotten son Jesus Christ to die for the sake of your sins (John 3:16). Please repent and be born again!
Hi Nees, could you please advise how to deal when I have a term in several options (sgd, SDGs, sustainable development goal). I tried to change .txt file but it doesn't work.
Merging terms can be done by creating a thesaurus file and by providing this file as input to VOSviewer. Please see the VOSviewer manual for more information about thesaurus files.
@@neesjanvaneck Yes, I did but it doesn't work. I created thesaurus file in the Label column I indicated all variations and replace by column indicated alternative label. I saved as thesaurus_terms and uploaded with data-file. Finally I get a map with variations. Still trying :(
@@socialentrepreneurshipKG Could you send me your VOSviewer thesaurus file and the file containing the bibliographic data that you want to visualize? I will then try to take a look at your problem.
@@neesjanvaneck It works properly, Thanks a lot I found the video where they show how to upload a thesaurus file. Thanks a lot for Vosviewer; it helped me a lot. I wish you and your team success!
@@neesjanvaneck can we visualize by uploading articles in pdf form?
Hi, Can you please address my query I have a file in EndNote format and when I import it too VosViewer, it shows me only two options; Co-authorship and Co-occurrence. How can I get other options like bibliographic coupling, co-citation, citations etc? I have already updated VosViewer to the latest version. Thank You.
I also want to know, please....
this usually means the metadata you have downloaded lacks cited references
Congratulations! Excellent!
Excellent features.. But how to prepare VOSviewer map and network file?
please let me know if you got the answer
@@christelleitole4656 See documentation :)
@@marciar.ferreira4363 which documentation? could you give any link?
Here is what I figured. 1. Scopus - do a search, and download the output as a csv file. Input this file in the next step. 2. VOSviewer - File > Create > Create a map based on bibliographic data > Scopus/filename > Type-of-analysis=Co-occurrence, Unit-of-analysis=All-keywords. This will populate the panels: Network Visualization, Overlay Visualization, Density Visualization. 3. VOSviewer - File > Save > enter a filename for map file, network file. This will create (save) the Map file and Network file (in the same folder as the scopus file in step 1).
Keep the good work going. No words to thank you and your university. May God bless. Adding LENS is amazing.
Super, thank you
Thanks for your information sir
Brilliant! Thanks for the splendid work!