
- Видео 483
- Просмотров 444 716
the outlier 73
Индия
Добавлен 22 фев 2021
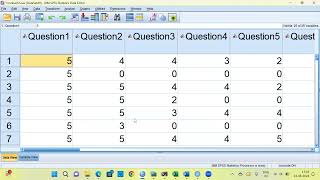
Step by Step guide to Principal Component analysis (PCA) in SPSS
Welcome to our comprehensive guide on Principal Component Analysis (PCA) using SPSS. In this tutorial, we'll walk you through the entire process, from loading your wholesale price index data to interpreting the final results. You'll learn how to perform PCA, create and analyze scree plots, and build path diagrams. Whether you're a beginner or looking to refine your skills, this step-by-step guide will help you understand and apply PCA effectively. Don't forget to like, share, and subscribe for more in-depth statistical tutorials!
Step-by-Step Guide to Principal Component Analysis (PCA) in SPSS
1. Introduction to PCA
- Overview of PCA and its importance in data analysis.
2. Loading Data into...
Step-by-Step Guide to Principal Component Analysis (PCA) in SPSS
1. Introduction to PCA
- Overview of PCA and its importance in data analysis.
2. Loading Data into...
Просмотров: 6
Видео


1992 Presidential Election Data Analysis: Chi-Square & CHAID Decision Trees
Просмотров 724 часа назад
Welcome to our deep dive into the fascinating world of election data analysis! 📊 In this video, we explore the 1992 Presidential Election dataset using advanced statistical techniques and decision tree analysis. Join us as we: 1. Perform an Exploratory Data Analysis (EDA) to uncover hidden patterns and trends. 2. Use the Chi-Square test to analyze the relationship between categorical variables....


SPSS Graphs for Beginners: Pie Chart, Bar chart and Histogram with Normal Curve
Просмотров 49Месяц назад
Welcome to our comprehensive guide for beginners on creating graphs in SPSS! In this video, we'll walk you through the steps to create three essential types of graphs: pie charts, bar charts, and histograms with a normal curve overlay. Whether you're a student, researcher, or data enthusiast, this tutorial will help you visualize your data effectively and understand the basics of SPSS graphing....
Reliability Analysis: Comparing Cronbach's Alpha and Guttman's Split-Half Coefficient
Просмотров 94Месяц назад
Reliability Analysis: Comparing Cronbach's Alpha and Guttman's Split-Half Coefficient In this video, we delve into the world of reliability analysis, focusing on two key coefficients: Cronbach's Alpha and Guttman's Split-Half Coefficient. We'll explain what each coefficient measures, how they are calculated, and their significance in ensuring the reliability of tests and questionnaires. Additio...

SPSS Graphs Made Easy: Pie Charts, Clustered Boxplots, Scatterplots, SPLOM, and Heatmaps
Просмотров 87Месяц назад
Welcome to "SPSS Graphs Made Easy: Pie Charts, Clustered Boxplots, Scatterplots, SPLOM, and Heatmaps"! This beginner-friendly tutorial is designed to help you master the art of creating and interpreting various types of graphs in SPSS. In this video, we will cover: - How to create pie charts to visualize proportions - Building clustered boxplots for comparing distributions across categories - U...

SPSS Graphs Made Easy: Bar Charts, Stacked Bar Charts, Histograms, Dot Plots, Boxplot(For Beginners)
Просмотров 52Месяц назад
Welcome to "SPSS Graphs Made Easy: Bar Charts, Stacked Bar Charts, Histograms, Dot Plots, Boxplots"! This beginner-friendly tutorial will guide you through creating and interpreting various types of graphs in SPSS. Learn how to: - Create clear and informative bar charts and stacked bar charts - Generate detailed panel histograms - Visualize data using dot plots - Understand and use boxplots for...

Predicting Loan Defaults with QUEST: A Step-by-Step Guide
Просмотров 56Месяц назад
Welcome to our in-depth tutorial on using the QUEST decision tree algorithm in SPSS to predict loan defaults! In this video, we'll cover everything you need to know, from the advantages and disadvantages of the QUEST algorithm to a step-by-step demonstration of its implementation in SPSS. 📚 What You'll Learn: 1. Introduction to QUEST Algorithm: An overview of the QUEST (Quick, Unbiased, Efficie...

Karnataka Disability Data with SPSS: Hierarchical cluster analysis, Dendrogram, Tree Custom Tables
Просмотров 45Месяц назад
Welcome to our detailed analysis of Karnataka's Disability Data using SPSS! In this video, we will guide you through the process of analyzing disability data for Karnataka, with a focus on Hierarchical Cluster Analysis (HCA) and generating Custom Tables. What You'll Learn: 🔍 Hierarchical Cluster Analysis (HCA): - Understand the fundamentals of HCA. - Learn how to create and interpret dendrogram...
Maternal Mortality Rate analysis
Просмотров 59Месяц назад
Welcome to our in-depth exploration of the Maternal Mortality Ratio (MMR) across Karnataka's 30 districts and 240 taluks! The MMR refers to the number of maternal deaths per 100,000 live births, a crucial indicator of maternal health. In this video, we delve into the most recent and specific MMR data for each district in Karnataka, drawing from a variety of authoritative sources. Whether you're...
Robust Statistical Modeling with M-Estimators in SPSS (For Advanced SPSS users)
Просмотров 54Месяц назад
Robust Statistical Modeling with M-Estimators in SPSS Welcome to our in-depth tutorial on Robust Statistical Modeling with M-Estimators in SPSS! In this video, we explore the powerful world of M-estimators and demonstrate how they can enhance the robustness of your statistical models in SPSS. Whether you're dealing with outliers, skewed data, or other irregularities, M-estimators provide a resi...
Missing Value Analysis using MCMC (Markov Chain Monte Carlo) Simulation and Bayesian Inference.
Просмотров 80Месяц назад
Learn how to use MCMC (Markov Chain Monte Carlo) to effectively handle missing data in your datasets. This method allows you to simulate multiple possible values based on observed patterns, ensuring robust imputation even for complex data. We'll break down the process into five straightforward steps: defining your model, setting initial values, iteratively sampling data, evaluating convergence,...
Bank Loan Default Prediction: CART Model in SPSS with 5-Fold Cross Validation
Просмотров 55Месяц назад
Unlock the power of predictive analytics with our step-by-step guide to predicting bank loan defaults using the CART model in SPSS. In this video, we'll walk you through the process of setting up and running a 5-Fold Cross Validation, ensuring your model is robust and reliable. Whether you're a data science enthusiast or a finance professional, this tutorial will equip you with the skills to en...
Day 5: CHAID vs CART vs QUEST, Two Step Cluster Analysis & Missing value imputation using MCMC
Просмотров 46Месяц назад
Day 5: CHAID vs CART vs QUEST, Two Step Cluster Analysis & Missing value imputation using MCMC
PCA, K-Means Clustering, and Neural Networks in SPSS
Просмотров 149Месяц назад
PCA, K-Means Clustering, and Neural Networks in SPSS
Day 3: Understanding Logistic Regression: A Beginner's Guide
Просмотров 29Месяц назад
Day 3: Understanding Logistic Regression: A Beginner's Guide
Day 2: FDP on SPSS | T Test, Linear Regression
Просмотров 48Месяц назад
Day 2: FDP on SPSS | T Test, Linear Regression
Day1: Enhance Your Research Skills: FDP on SPSS for Data Analysis
Просмотров 54Месяц назад
Day1: Enhance Your Research Skills: FDP on SPSS for Data Analysis
Big or Small, Protect Them All: Help Us Understand Breast Cancer
Просмотров 22Месяц назад
Big or Small, Protect Them All: Help Us Understand Breast Cancer
How to Create a Population Pyramid Chart in SPSS | Step-by-Step Tutorial
Просмотров 118Месяц назад
How to Create a Population Pyramid Chart in SPSS | Step-by-Step Tutorial
Ch1: How to import a Excel File in SPSS for Beginners
Просмотров 38Месяц назад
Ch1: How to import a Excel File in SPSS for Beginners
SPSS Transform Menu Compute variable| SPSS for Beginners: Creating New Variables from Existing Data
Просмотров 56Месяц назад
SPSS Transform Menu Compute variable| SPSS for Beginners: Creating New Variables from Existing Data
Forward Selection Explained: Linear Regression with Boston Housing Dataset
Просмотров 69Месяц назад
Forward Selection Explained: Linear Regression with Boston Housing Dataset
Your Gateway to Machine Learning: A Tour of the UCI ML Repository
Просмотров 1043 месяца назад
Your Gateway to Machine Learning: A Tour of the UCI ML Repository
SPSS Decision Tree: Classification and Decision Tree
Просмотров 3453 месяца назад
SPSS Decision Tree: Classification and Decision Tree
Launch of Post Graduation Diploma in Business Analytics (PGDBA)
Просмотров 1989 месяцев назад
Launch of Post Graduation Diploma in Business Analytics (PGDBA)
The Ultimate Showdown: ARIMA, SARIMA & SARIMAX Which Will Take the Crown for Time Series Forecasting
Просмотров 782Год назад
The Ultimate Showdown: ARIMA, SARIMA & SARIMAX Which Will Take the Crown for Time Series Forecasting
Cracking the Code: Demystifying Stationarity in Time Series Analysis!
Просмотров 64Год назад
Cracking the Code: Demystifying Stationarity in Time Series Analysis!
The BERT Model: Unlocking the Secrets of NLP's Most Exciting Advancement Yet!
Просмотров 43Год назад
The BERT Model: Unlocking the Secrets of NLP's Most Exciting Advancement Yet!
Very helpful sir 🔥
Thanks
👍
Did Perot pull votes from Clinton or Bush?
The other way round!!!
Nice video Sir...very very useful 👍
thanks
Sir, can we use this factor as a variable for regression. Also, do we need to consider them as negative values or absolute values?
you can use the factor scores as variables
Also, When interpreting factor scores from factor analysis, it is important to use the scores as they are, including both negative and positive values. These scores indicate the relative positioning of observations along the factor dimensions. Converting them to absolute values would distort the interpretation and relationships identified by the factor analysis. Negative values are meaningful and represent observations that are below the mean of the factor, while positive values are above the mean.
Nice explanation 😊
thanks
Great👍👏 explanation sir
Thanks
Very important and helpful video..
thanks
Educative
Thanks for your kind words, Appreciate it
At 19:40 when u expain support @18% of the total samples, you say that out of 1000 customers 18% of them purchased Freshmeat, CannedVeg, SoftDrink and Dairy. Is it true that they purchased CannedVeg despite it being a False in the row? Thanks.
good observation .people have not purchased cannedved
Do we need to eliminate seasonality as we prepare data for Market Basket Analysis. For e.g., people may buy bread and butter in summer, versus the same people may buy bread and jam in winter. How would this affect the analysis? Or should I do a separate analysis for summer vs winter if I expect a strong seasonality signal? Thanks for ur views.
no need
Nnknooon8nnnijknykknooom
Mh
Thanks!
Thank you for this. My result is not displaying the KMO and bartlett result. Could there be any reason for this?
if you are using SPSS, pleasse go to analyze menu, dimension reduction, factor, this open up factor analysis dialog box. one you are inside factor analysis dialog box at the right hand side you have descriptive statistics tab. please click on descriptive statistics tab. this will open up a new dialog box . the last option here is KMO and bartketts test of shericity. please make sure you select this click ok. you should get the kmo result
if you are having issues please let me know
Excellent! Very clear and audible! Took your time to explain! Thank you so much!
Thanks All the best
i did survey, and had 4 study groups. in that case, is it possible to run PCA on SPSS
Yes you can go ahead with PCA
@@theoutlier7395 Could you help me with running PCA in SPSS? I'm analyzing a dataset with 4 study groups and 400 samples to find where risk factors cluster the most. Your guidance would be valuable!
The title is about homoschedasticity while the pressentation is about hetro😊
Hello my friend. I checked and made the Factor Analysis just like you, but within Excel there is alway just one Sheet. Can you help me so that I can see Heat Map / Eigen Value? I checked the descriptive statistic option in PCA but could not find it directly
Hi, i have created the factor loading and the other output by running analysis in SPSS. it is not part of the raw data provided
@@theoutlier7395 thank you very much for the clarification
All the best..
Nice video ...
Very clear
Thanks
Thank you for this video - very informative! I’ve only recently found Orange - it looks very interesting. Can you recommend anything for how to report these results as part of a research paper?
When it comes to research paper publication SPSS is preferred over orange. Orange output export capability is weak and sometimes a struggle.
Wonderful video.
Ma'am could you please explain how to do absolute principle component score - multiple linear regression (APCS MLR) modelling in SPSS.
sure
Wonderful explanation, very clear and precise. Thankyou.
Glad you liked it, All the best
great channel
Thanks, Glad you like it
What is the variable name of rc1, rc2, rc3 means mm
rotated component one, rotated component two
@@theoutlier7395 then Sir I have to remove the first three variable from my analysis and have to add this rc variable....is it? But in my paper what should I write about my factor/variable name, because this is different name variable from others variable name.
@@sureshmondal8702 you dont need to remove the original variables. Please look at the loading table to name the factors
You have to look at the highest loading for each component
Thanks for helping us finding the sample files!
All the best, Appreciate your comments...
Sir agar hum bar chart ya box plot ko use na kare. Toh sirf t test mein jo mean difference nikal k aya hai wo yeh dikha rha hai ki male ko jada wage mila hai ya female ko yeh kese pata kare? Sir yeh samjha dijiye na.
Thanks for the question, Please look at the first table namely group statistics table under t test section. You can clearly see that average female salary is 26031 and for males it is 41441. The difference between these two numbers is 15409 which is the mean difference
Since male employees are getting 41441 which is greater than female employees 26031. Male employees average salary is higher. Hopw that answers your question
I liked the way you explained the content, systematically and the summary at the end. Great ! Thanks for the explanation.
Excellent clarity...
super clear, this was so helpful! thank you!
thanks
Great 💯
thanks
can you drop me your data and file? thank you man
This channel is awesome.. thanks for the great video..
Thank you for your support, All the best...
Superb vedio
Thanks
Thank you. This is very helpful. Thank you for sharing the data.
Excellent tutorial. Please, how do/did you create ur training and test data??
ruclips.net/video/VatSJGnUPzQ/видео.html
@@theoutlier7395 really appreciate 🙏
Can PCA tells us which original variables to retain for certain statistical analysis?
If the loading is greater than .7 retain it
how to determine sum of squares (eigenvalues) and percentage of error for given factor scores?
spss displays eigen values by default
hi sir, where should i look for commenting about clustering ? silhette skor or collecting on the center ?
Slightly hard to do this in Orange
@@theoutlier7395 can i do it just looking on the label with silhouette skor ? for instance if silhouette skor is huge, then it is more trustable ?
sir i have some questions to you. ı have a survey executed. options are similar to this : 1. ı know / ı dont know 2. ı speak / ı dont speak so, PDF AND CDF needs to be calculated. how can I do it ? and i need to median , mod of the words as well how can i do
Not sure what is the need to calculate PDf and CDF, SPSS compte variable has what you need
Median: use SPSS Explore
Mode is not easy in SPSS
@@theoutlier7395 Standart deviation , mean value can be obtained via Distribiuton widget on Orange datatable ? What i obtained in the distribition widget ,s about Normal Distribution ? Shortly can i get results of normal distribiuton in orange ?
@@theoutlier7395 thanks sir. how can i make corelation in orange. ? i dont have numeric values
When we have dependent variable so Do we have to select dependent variable also for PCA? And we get factor after this what can we do for the interpretation?
use only independent variables for factor analysis
how can i get output as a txt or xls format
after getting the output of market basket analysis in the left hand side bottom side next to question mark you have a option to get the output in text format
@@theoutlier7395 can i do it for all association rules ?
@@theoutlier7395 ı want to use the datas in my thesis
@@theoutlier7395 i could not do it can yoy help me ? can i get output by creating automatically association rııles ?
@@theoutlier7395 sir i have some questions to you. ı have a survey executed. options are similar to this : 1. ı know / ı dont know 2. ı speak / ı dont speak so, PDF AND CDF needs to be calculated. how can I do it ? and i need to median , mod of the words as well how can i do
I appreciate the video, thank you so much. It is very informative and useful. Can you please tell me what value is observed in each internal node in the tree? Also, I have run a split sample validation procedure where I obtained the risk estimate for training as 150.14 and for test as 148.00. What can we infer from that? Thank you in advance.
Assuming that the dependent variable is a scale variable in each of the node you are getting the mean valye of the dependent variable satisfying the rule.
On a average the error between actual and predicted in training data is 50.14 and for test as 148.00 respectively. If this value is closer to zero it is better
@@theoutlier7395 Thank you for the reply. So if the risk estimate is high does that mean the model is wrong?
@@theoutlier7395 Hi, My dependent variable is a scale variable and it ranges from 0 to 100. Is it okay if get a risk estimate value above 100? Thanks in advance.
@@nimmyprakash3193 Try to redice the risk estimate to a lower score
Very nice!
Thanks All the best
it mean a lot to me. I try to do CART but my tree haven't leafs . help me please
hi Please check if you have sufficient sample size
Looks like your data has low sample size
Once you are In SPSS decision tree, right hand side there is an oprion called "criteria" button click on it. then reduce the parent node sample to a lesser number . Also reduce the child node to lesser number. Re Run the analysis. IT should work
in case you still have issues we can have a zoom call, Please feel free to ping me
@@theoutlier7395 Hello you were right, I reduced the number of knots and it worked. You can't imagine how happy I am this morning. Thank you so much. God bless you